


 本文深入探讨了图像处理中的多种滤波技术,包括均值、高斯、中值及双边滤波,并展示了如何通过Python的OpenCV库实现这些滤波效果。此外,还介绍了图像锐化滤波器的原理及其在实际应用中的表现。
导入库函数:
	import chardet
	import numpy as np
	import cv2 as cv
	import cv2
	from PIL import Image
	import sys
	from matplotlib import pyplot as plt
平滑模糊滤波:
均值滤波blur()、
高斯滤波GaussianBlur()、
中值滤波medianBlur()、
双边滤波bilateralFilter()
def add_salt_noise(img, snr=0.5):
# 指定信噪比
SNR = snr
# 获取总共像素个数
size = img.size
# 因为信噪比是 SNR ,所以噪声占据百分之10,所以需要对这百分之10加噪声
noiseSize = int(size * (1 - SNR))
# 对这些点加噪声
for k in range(0, noiseSize):
# 随机获取 某个点
xi = int(np.random.uniform(0, img.shape[1]))
xj = int(np.random.uniform(0, img.shape[0]))
# 增加噪声
if img.ndim == 2:
img[xj, xi] = 255
elif img.ndim == 3:
img[xj, xi] = 0
return img
img=cv.imread("D:/1/5.jpg",1)
img_salt = add_salt_noise(img, snr=0.99)
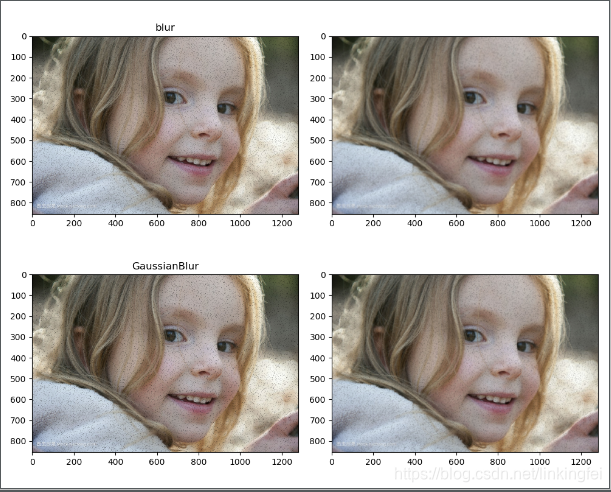
blured = cv.blur(img, (3, 3))
blured1 = cv.blur(img, (7,7))
blured2= cv.GaussianBlur(img, (3,3), 0)
blured3=cv.GaussianBlur(img, (7,7), 0)
plt.figure(figsize=(10, 8))
plt.subplot(221)
plt.title("blur")
plt.imshow(blured[:,:,::-1])
plt.subplot(222)
plt.imshow(blured1[:,:,::-1])
plt.subplot(223)
plt.title("GaussianBlur")
plt.imshow(blured2[:,:,::-1])
plt.subplot(224)
plt.imshow(blured3[:,:,::-1])
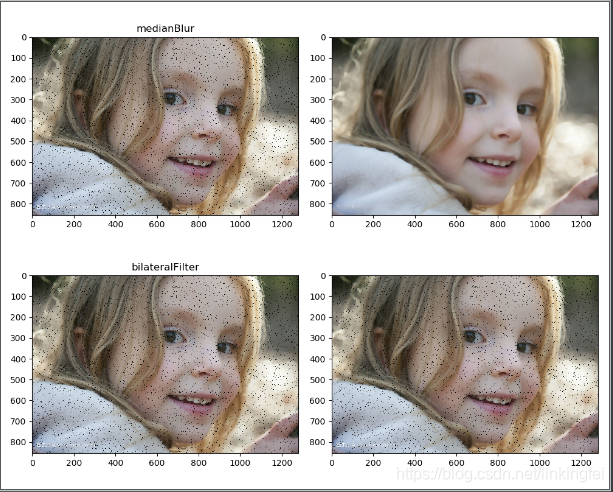
b1 = cv.medianBlur(img, 1)
b2 = cv.medianBlur(img, 9)
b3 = cv.bilateralFilter(img, 9, 5, 5)
b4 = cv.bilateralFilter(img, 9, 50, 50)
plt.figure(figsize=(10, 8))
plt.subplot(221)
plt.title("medianBlur")
plt.imshow(b1[:,:,::-1])
plt.subplot(222)
plt.imshow(b2[:,:,::-1])
plt.subplot(223)
plt.title("bilateralFilter")
plt.imshow(b3[:,:,::-1])
plt.subplot(224)
plt.imshow(b4[:,:,::-1])
plt.show()
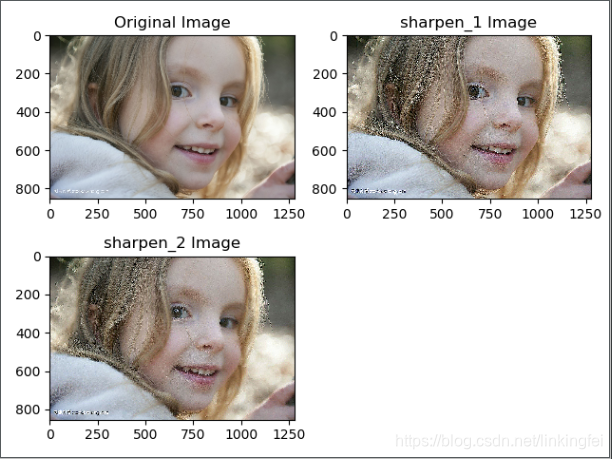
图像锐化滤波器:
	image = cv2.imread('D:/1/5.jpg',1)
	kernel_sharpen_1 = np.array([
	        [-1,-1,-1],
	        [-1,9,-1],
	        [-1,-1,-1]])
	kernel_sharpen_2 = np.array([
	        [1,1,1],
	        [1,-7,1],
	        [1,1,1]])

	# #卷积
	output_1 = cv2.filter2D(image,-1,kernel_sharpen_1)
	output_2 = cv2.filter2D(image,-1,kernel_sharpen_2)

	plt.figure()
	plt.subplot(221)
	plt.title('Original Image')
	plt.imshow(image[:,:,::-1])
	plt.subplot(222)
	plt.title('sharpen_1 Image')
	plt.imshow(output_1[:,:,::-1])
	plt.subplot(223)
	plt.title('sharpen_2 Image')
	plt.imshow(output_2[:,:,::-1])
	plt.show()


 27万+
27万+

 被折叠的 条评论
为什么被折叠?
被折叠的 条评论
为什么被折叠?
 到【灌水乐园】发言


