


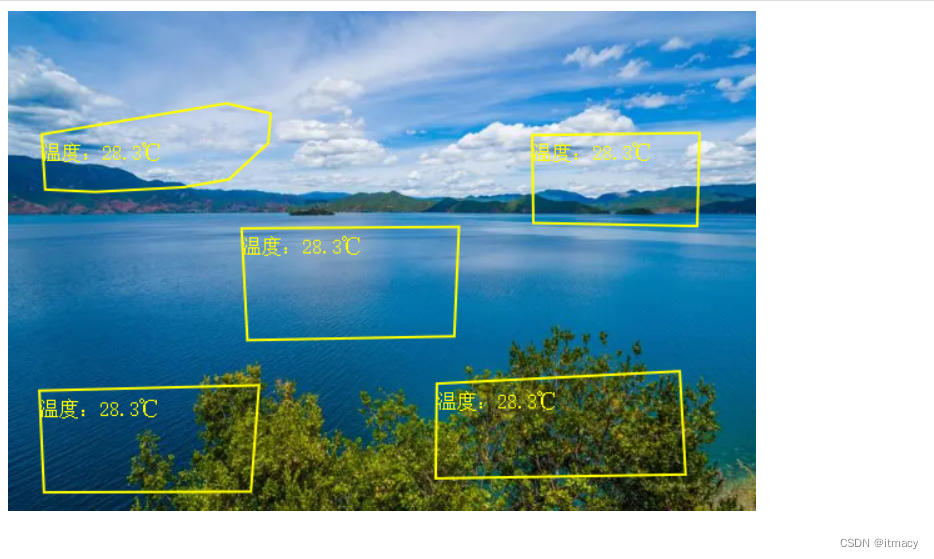
 该代码示例演示了如何在HTML5canvas上结合图片、文本和不规则多边形来显示特定区域的温度数据。通过调整坐标点,可以绘制多个多边形,并在每个多边形内标注温度值。
结合前面的几个案例,使用canvas加载图片、文本以及不规则多边形,整合出一个综合小案例,用于展示指定区域的温度数据,代码如下
<!DOCTYPE html>
<html lang="en">
<head>
    <meta charset="UTF-8">
    <title>Title</title>
</head>
<body>
<canvas id="canvas" width="400" height="400"></canvas>

<script>

  const pointList = [
      [
          {
              "x": 0.045031,
              "y": 0.246894
          },
          {
              "x": 0.049689,
              "y": 0.357143
          },
          {
              "x": 0.11646,
              "y": 0.361801
          },
          {
              "x": 0.234472,
              "y": 0.352484
          },
          {
              "x": 0.295031,
              "y": 0.336957
          },
          {
              "x": 0.347826,
              "y": 0.263975
          },
          {
              "x": 0.350932,
              "y": 0.204969
          },
          {
              "x": 0.291925,
              "y": 0.184783
          }
      ],
      [
          {
              "x": 0.700311,
              "y": 0.248447
          },
          {
              "x": 0.701863,
              "y": 0.423913
          },
          {
              "x": 0.920807,
              "y": 0.430124
          },
          {
              "x": 0.923913,
              "y": 0.243789
          }
      ],
      [
          {
              "x": 0.312112,
              "y": 0.434783
          },
          {
              "x": 0.319876,
              "y": 0.658385
          },
          {
              "x": 0.596273,
              "y": 0.650621
          },
          {
              "x": 0.602484,
              "y": 0.431677
          }
      ],
      [
          {
              "x": 0.041925,
              "y": 0.759317
          },
          {
              "x": 0.048137,
              "y": 0.962733
          },
          {
              "x": 0.324534,
              "y": 0.96118
          },
          {
              "x": 0.335404,
              "y": 0.748447
          }
      ],
      [
          {
              "x": 0.572981,
              "y": 0.745342
          },
          {
              "x": 0.571429,
              "y": 0.934783
          },
          {
              "x": 0.90528,
              "y": 0.927019
          },
          {
              "x": 0.897516,
              "y": 0.720497
          }
      ]
  ]

  drawImg()

  function drawImg () {
    const canvas = document.querySelector('#canvas')
    const c2 = canvas.getContext('2d')
    const image=new Image()
    image.src = 'https://img0.baidu.com/it/u=741268616,1401664941&fm=253&fmt=auto&app=138&f=JPEG?w=748&h=500'
    // 等比例缩放图片
    image.onload = () => {
      const _width = image.width * 0.8
      const _height = image.height * 0.8
      canvas.setAttribute('width', _width)
      canvas.setAttribute('height', _height)
      // 绘制图片
      c2.drawImage(image, 0, 0, image.width, image.height, 0, 0, _width, _height)
      pointList.forEach(item => {
         // 绘制多边形
         drawPolygon(item, _width, _height)
         // 绘制文本
         drawText('温度:28.3℃', item[0].x * _width, item[0].y * _height + 20)
      })
    }
  }

  function drawText (str, x, y) {
      const canvas = document.querySelector('#canvas')
      const c2 = canvas.getContext('2d')
      // 绘制文字
      c2.beginPath()
      c2.fillStyle = '#ffff00'// 设置填充画笔颜色,即字体颜色
      c2.font = `16px serif` // 设置字体大小
      c2.fillText(str, x , y ) // 绘制 "实心" 文字
      c2.closePath()
  }

  function drawPolygon(pointList, offsetX, offsetY) {
      const canvas = document.querySelector('#canvas')
      const c2 = canvas.getContext('2d')
      // 设置属性控制图形的外观
      c2.fillStyle = 'rgba(255, 255, 255, 0)'
      // 外部使用外边框
      c2.strokeStyle = '#ffff00'
      // 线宽
      c2.lineWidth = 2
      c2.beginPath()
      for (let i = 0; i < pointList.length; i++) {
          const data = pointList[i]
          if (i === 0) {
              c2.moveTo(data.x * offsetX, data.y * offsetY)
          }else {
              c2.lineTo(data.x * offsetX, data.y * offsetY)
          }
      }
      c2.closePath()
      c2.fill()
      c2.stroke()
  }

</script>
</body>
</html>
预览效果如下


 1026
1026

 被折叠的 条评论
为什么被折叠?
被折叠的 条评论
为什么被折叠?
 到【灌水乐园】发言


