


目录
QCharts 创建步骤
1. 创建一个Qt widgets application,并在*.pro中添加以下代码,run qmake
QT += core gui sql charts2. 创建QChartView
只需在生成的mainwindow.cpp中添加以下四行代码,就完成了QChartView的创建。
#include "mainwindow.h"
#include "ui_mainwindow.h"
#include <QtCharts/QChartView> // 手动添加代码行1
using namespace QtCharts; // 手动添加代码行2
MainWindow::MainWindow(QWidget *parent) :
QMainWindow(parent),
ui(new Ui::MainWindow)
{
ui->setupUi(this);
QChartView * _chart_view = new QChartView;// 手动添加代码行3
this->setCentralWidget(_chart_view);// 手动添加代码行4
}
MainWindow::~MainWindow()
{
delete ui;
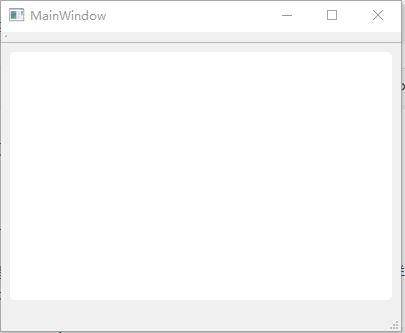
}现在我们已经完成了,QChartView的创建,编译并运行,可以看到如下效果,白色部分就是我们创建的chartview,什么也没有是因为我们没有在上边添加series.
如果在*.ui中拖拽也可以完成QChartView创建工作,不过需要prompt.
我一般是在程序里直接代码创建widget(这样做的好处是便于版本管理,当然这只是个人习惯)。
3. 绘制曲线,添加数据
这里我们给chart添加一条曲线:
#include "mainwindow.h"
#include "ui_mainwindow.h"
#include <QtCharts/QChartView>
#include <QLineSeries>

using namespace QtCharts;
MainWindow::MainWindow(QWidget *parent) : QMainWindow(parent),ui(new Ui::MainWindow) {
    ui->setupUi(this);
    Q
最低0.47元/天 解锁文章


 515
515

 被折叠的 条评论
为什么被折叠?
被折叠的 条评论
为什么被折叠?
 到【灌水乐园】发言


