


 本文深入探讨了支持向量机(SVM)的kernel与C参数的作用原理,通过可视化展示了不同参数下SVM的决策边界变化,并通过手写数字识别的实际案例,演示了如何使用SVM进行复杂模式的分类。
kernel参数
from sklearn.datasets import make_circles
from sklearn.preprocessing import StandardScaler
from sklearn.svm import SVC
import numpy as np, matplotlib.pyplot as mp
# 创建随机样本、数据标准化
X, y = make_circles(noise=.1, factor=.4)
X = StandardScaler().fit_transform(X)
# 建模、训练
for e, kernel in enumerate(['linear', 'rbf'], 1):  # Radial Basis Function
    clf = SVC(kernel=kernel)
    clf.fit(X, y)
    # 可视化
    mp.subplot(1, 2, e)  # 散点图
    mp.scatter(X[:, 0], X[:, 1], s=40, c=y)
    x_min, x_max = X[:, 0].min() - .5, X[:, 0].max() + .5
    y_min, y_max = X[:, 1].min() - .5, X[:, 1].max() + .5
    xx, yy = np.meshgrid(np.arange(x_min, x_max, .01), np.arange(y_min, y_max, .01))
    Z = clf.decision_function(np.c_[xx.ravel(), yy.ravel()]).reshape(xx.shape)
    mp.contourf(xx, yy, Z, 0, alpha=.2)  # 等高线图
mp.show()
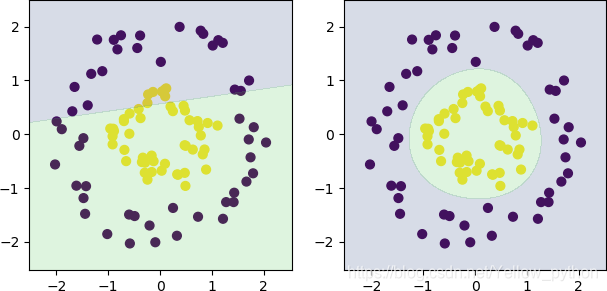
高斯核函数可处理线性不可分的问题
C参数
from sklearn.svm import SVC
import numpy as np, matplotlib.pyplot as mp

# 创建随机样本集
X = np.array([(1, 2), (2, 1), (1, 3), (2, 2), (3, 1), (7, 9), (8, 8), (9, 7), (8, 9), (9, 8)] * 999 + [(6, 9)])
y = [1, 1, 1, 1, 1, 0, 0, 0, 0, 0] * 999 + [1]

for e, C in enumerate([999, 0.1]):
    # 建模、设置参数、训练
    model = SVC(C=C, kernel='linear')
    model.fit(X, y)
    # 可视化
    mp.subplot(1, 2, e + 1)  # 散点图
    mp.scatter(X[:, 0], X[:, 1], s=40, c=y)
    x_min, x_max = X[:, 0].min() - .5, X[:, 0].max() + .5
    y_min, y_max = X[:, 1].min() - .5, X[:, 1].max() + .5
    xx, yy = np.meshgrid(np.arange(x_min, x_max, .01), np.arange(y_min, y_max, .01))
    xy = np.vstack([xx.ravel(), yy.ravel()]).T
    Z = model.decision_function(xy).reshape(xx.shape)
    mp.contourf(xx, yy, Z, 2, alpha=.1, levels=[-1, 0, 1])  # 等高线图
mp.show()
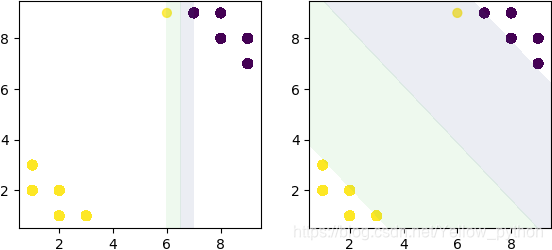
C越大,分类越严格
C越小,容错度越高
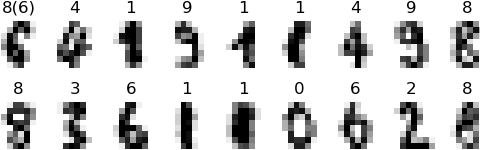
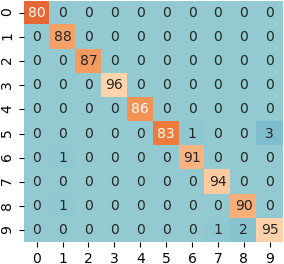
手写字体识别
# 3、实例:手写字体识别
import matplotlib.pyplot as mp, seaborn
from sklearn import datasets, svm, metrics, model_selection

# 加载数据:手写数字
digits = datasets.load_digits()
X, y = digits.data, digits.target
X_train, X_test, y_train, y_test = model_selection.train_test_split(X, y, test_size=0.5)

# 支持向量机分类器:建模、拟合、预测
svc = svm.SVC(gamma=0.001)
svc.fit(X_train, y_train)
y_predict = svc.predict(X_test)

# 模型评估及可视化
for i in range(18):
    mp.subplot(2, 9, i + 1)
    mp.axis('off')
    mp.imshow(X_test[i].reshape(8, 8), cmap=mp.cm.gray_r)
    mp.title(y_predict[i] if y_predict[i] == y_test[i] else '%d(%d)' % (y_predict[i], y_test[i]))
mp.show()
print('Classification report:\n%s' % metrics.classification_report(y_test, y_predict))
matrix = metrics.confusion_matrix(y_test, y_predict)
print('Confusion matrix:\n%s' % matrix)
seaborn.heatmap(matrix, center=45, annot=True, cbar=False)
mp.show()
- 预测结果
- 混淆矩阵


 3993
3993

 被折叠的 条评论
为什么被折叠?
被折叠的 条评论
为什么被折叠?
 到【灌水乐园】发言


