


 本文介绍了sklearn库中内置的数据集,分为样本生成器和样本加载两类。样本生成器包括弯弯的月亮、画圈圈、一团一团和线性回归数据集;样本加载则涵盖波士顿房价、手写数字、鸢尾花和新闻主题20分类等经典数据集,通过实例展示了如何使用这些数据集。
1、简介
-
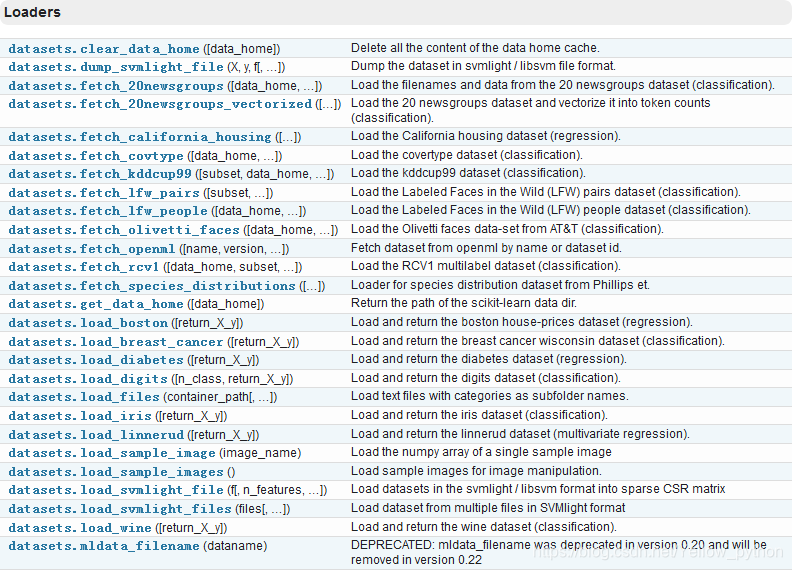
sklearn内置数据集,分别是【Samples generator】和【Loaders】
-
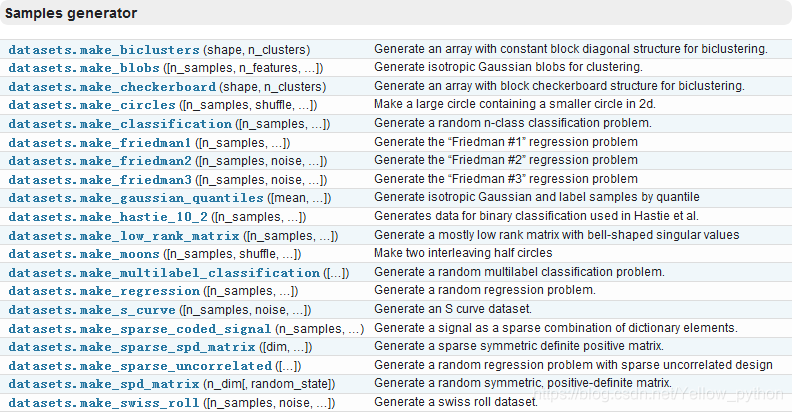
1、【samples generator】是生成数据的工具
2、【Loaders】是可直接加载的数据集
2、样本生成器
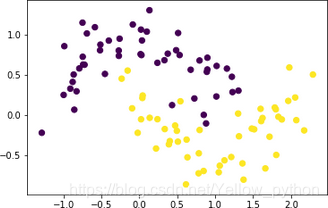
2.1、弯弯的月亮
from sklearn.datasets import make_moons
import matplotlib.pyplot as mp
X, y = make_moons(noise=.2)
mp.scatter(X[:, 0], X[:, 1], s=40, c=y)
mp.show()
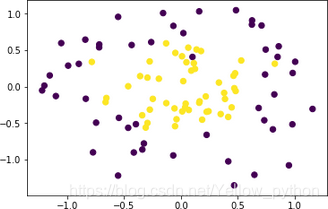
2.2、画圈圈
from sklearn.datasets import make_circles
import matplotlib.pyplot as mp
X, y = make_circles(noise=.2, factor=.4)
mp.scatter(X[:, 0], X[:, 1], s=40, c=y)
mp.show()
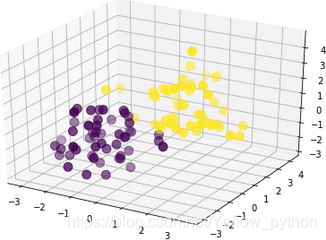
2.3、一团一团
from sklearn.datasets import make_blobs
import matplotlib.pyplot as mp
from mpl_toolkits import mplot3d  # 三维坐标轴
X, y = make_blobs(centers=[[-1, -1, -1], [1, 1, 1]], cluster_std=1)
ax = mplot3d.Axes3D(mp.figure())
ax.scatter(X[:, 0], X[:, 1], X[:, 2], s=99, c=y)
mp.show()
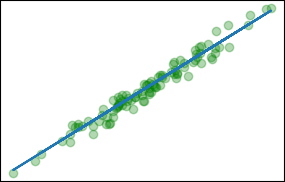
2.4、线性回归
from sklearn.datasets import make_regression
import matplotlib.pyplot as mp
# 创建数据
X, y, coef = make_regression(n_features=1, noise=9, coef=True)
x = X.reshape(-1)
# 可视化
mp.scatter(x, y, c='g', alpha=0.3)
mp.plot(x, coef * x)
mp.show()
3、样本加载
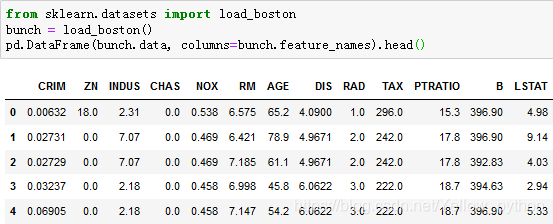
3.1、波士顿房价
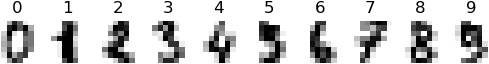
3.2、手写数字
from sklearn.datasets import load_digits
import matplotlib.pyplot as mp
digits = load_digits()
images, target, data = digits.images, digits.target, digits.data
print(images.shape, target.shape, data.shape)
# (1797, 8, 8) (1797,) (1797, 64)
for i in range(10):
    mp.subplot(1, 10, i + 1)
    mp.axis('off')
    mp.imshow(images[i], cmap=mp.cm.gray_r)
    mp.title(target[i])
mp.show()
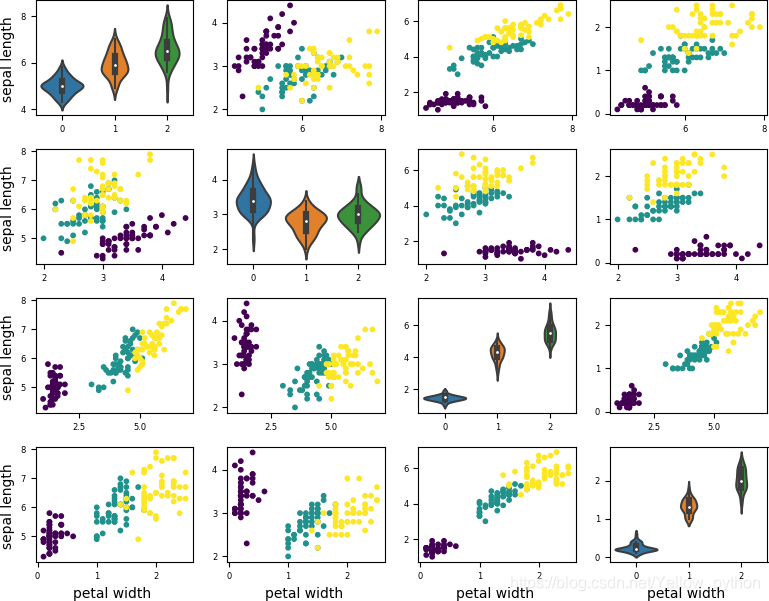
3.3、鸢尾花
from sklearn.datasets import load_iris
import matplotlib.pyplot as mp, seaborn
bunch = load_iris()
X = bunch.data
y = bunch.target
names = bunch.feature_names
mp.figure(figsize=(8, 7))
length = len(names)
for i in range(length):
    for j in range(length):
        mp.subplot(length, length, i * length + j + 1)
        if i == j:
            seaborn.violinplot(y, X[:, i])  # 小提琴图
        else:
            mp.scatter(X[:, i], X[:, j], 10, y)
        if i == length - 1:
            mp.xlabel(names[i].replace('(cm)', ''))
        if j == 0:
            mp.ylabel(names[j].replace('(cm)', ''))
mp.tight_layout()
mp.show()
3.4、新闻主题20分类
## 新闻主题20分类
from sklearn.datasets import fetch_20newsgroups
data_train = fetch_20newsgroups()
data = data_train.data  # 文本数据
target = data_train.target  # 标签索引
target_names = data_train.target_names  # 20个新闻组名称
print(data[0])
print('索引和对应组名', target[0], target_names[target[0]])
print('样本数', len(data), target.shape)
From: lerxst@wam.umd.edu (where's my thing)
Subject: WHAT car is this!?
Nntp-Posting-Host: rac3.wam.umd.edu
Organization: University of Maryland, College Park
Lines: 15

 I was wondering if anyone out there could enlighten me on this car I saw
the other day. It was a 2-door sports car, looked to be from the late 60s/
early 70s. It was called a Bricklin. The doors were really small. In addition,
the front bumper was separate from the rest of the body. This is
all I know. If anyone can tellme a model name, engine specs, years
of production, where this car is made, history, or whatever info you
have on this funky looking car, please e-mail.

Thanks,
- IL
   ---- brought to you by your neighborhood Lerxst ----

索引和对应组名 7 rec.autos
样本数 11314 (11314,)
4、附录
官网:https://scikit-learn.org/stable/modules/classes.html#module-sklearn.datasets
注释
| En | Cn |
|---|---|
| violin | 小提琴 |
| iris | 鸢(yuan)尾花 |
| sepal | 花萼 |
| petal | 花瓣 |


 1746
1746

 被折叠的 条评论
为什么被折叠?
被折叠的 条评论
为什么被折叠?
 到【灌水乐园】发言


