


 文章介绍了在R编程中,Tilde符号用于定义统计模型公式中的因变量和自变量关系。通过实例展示了如何进行两样本t检验以比较男孩和女孩的平均出生体重,以及使用var.test()进行方差检验。此外,还提及了Bonferroni校正在多测试中的应用。
Tilde in R ~
Tilde symbol l is used within formulas of statistical models, as mainly this symbol is used to define the relationship between the dependent variable and the independent variables in the statistical model formula in the R programming language. The left side of the tilde symbol specifies the target variable (dependent variable or outcome) and the right side of the tilde specifies the predictor variable(independent variables). (Source: https://www.geeksforgeeks.org/use-of-tilde-in-r/)
Below source: https://bookdown.org/danieljcarter/r4steph/two-sample-t-test.html
Two-sample t-test
We can also conduct a two-sample t-test to determine if the mean population birthweight in boys is the same as the mean population birthweight in girls. The syntax here is slightly different as it uses R’s formula interface. A formula is indicated by the presence of a tilde (~), and the tilde is shorthand for ‘estimate’. So the formula in the code chunk below says: estimate birthweight from sex. This is slightly counter-intuitive for the t-test but will make more sense when applied more generally under a regression framework later on.
We use the var.test() command to conduct an F test to assess whether the equality of variance assumption holds.
```r
#--- Run the two-sample t-test
bab9 %$% t.test(bweight ~ sex, var.equal = T)

##
##  Two Sample t-test
##
## data:  bweight by sex
## t = 3, df = 600, p-value = 0.001
## alternative hypothesis: true difference in means is not equal to 0
## 95 percent confidence interval:
##   66.6 267.7
## sample estimates:
##   mean in group male mean in group female
##                 3211                 3044
Bonferroni correction for multiple tests
Source: https://book.phylolab.net/binf8441/lab7.html
```r
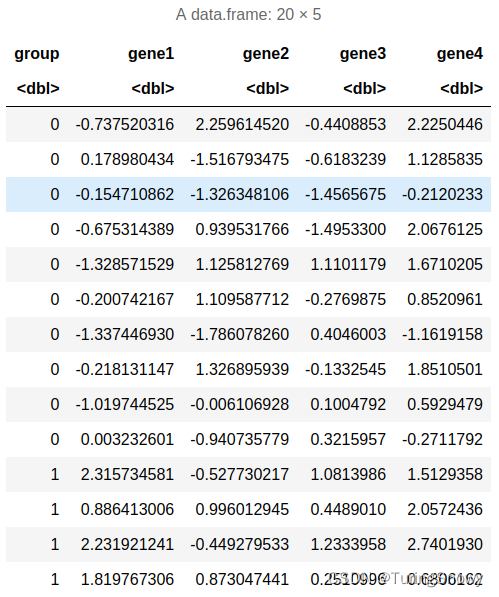
numtest = 4
pvalue = 1:numtest
for(i in 1:numtest){
pvalue[i] = t.test(data[,i+1] ~ data[,1])$p.value
}
print("the Bonferroni adjusted pvalues")
pvalue*numtest
We estimate the four columns based on the first column, 0 or 1 group. 是按照第一列分成的两组。
> t.test(data[,i+1] ~ data[,1])

	Welch Two Sample t-test

data:  data[, i + 1] by data[, 1]
t = -2.9682, df = 17.128, p-value = 0.008566
alternative hypothesis: true difference in means between group 0 and group 1 is not equal to 0
95 percent confidence interval:
 -2.6167353 -0.4430667
sample estimates:
mean in group 0 mean in group 1
      0.3970631       1.9269641


 86
86

 被折叠的 条评论
为什么被折叠?
被折叠的 条评论
为什么被折叠?
 到【灌水乐园】发言


