


目录
一、基础
import matplotlib.pyplot as plt
import numpy as np
import pandas as pd
x = [0,1,2,3,4]
y = [0,2,4,6,8]
# (5,3)*dpi即分辨率:500*300
plt.figure(figsize=(5,3),dpi=100)
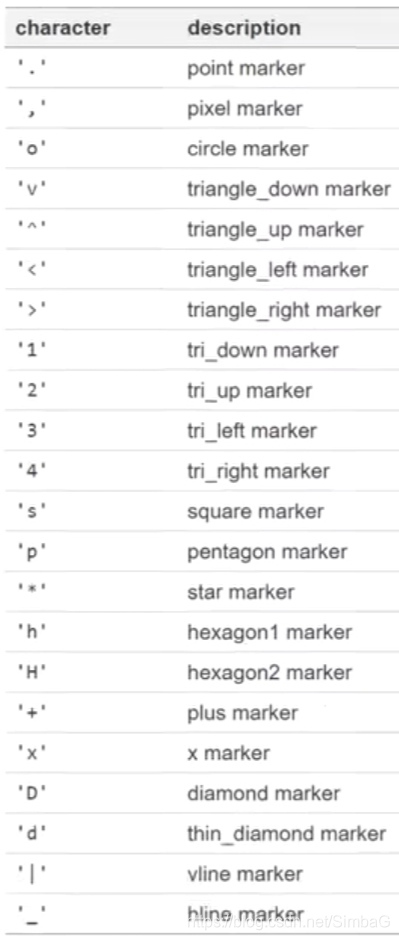
# plt.plot(x,y,label='2x',color='red',linewidth=2,marker='.',linestyle='--',markersize=10,markeredgecolor='b')
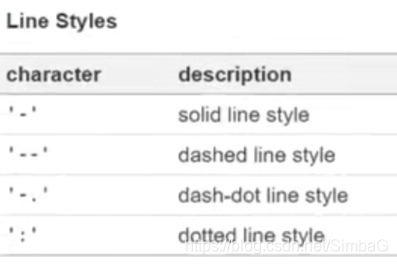
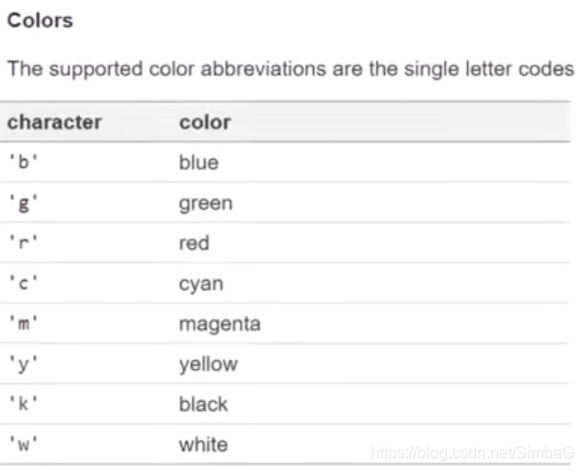
# 简短格式,'[color][marker][line]'
plt.plot(x,y,'b^--',label='2x')
# 第二条线
x2 = np.arange(0,4.5,0.5)
plt.plot(x2[0:6],x2[0:6]**2,'r',label='x^2')
plt.plot(x2[5:],x2[5:]**2,'r--')
# 标题
plt.title('first graph', fontdict={'fontname':'Comic Sans MS','fontsize':20})
plt.xlabel('x', fontdict={'fontname':'Arial'})
plt.ylabel('y')
# 刻度
plt.xticks([0,1,2,3,4])
plt.yticks([0,2,4,6,7,7.5,10])
plt.legend()
plt.savefig('mygraph.png',dpi=300)
plt.show()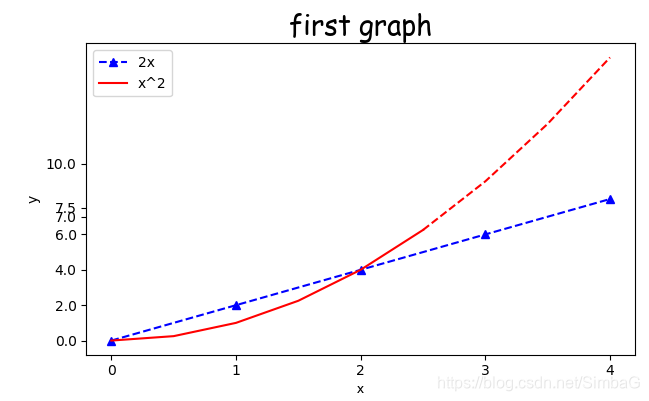
补充:
二、绘制图
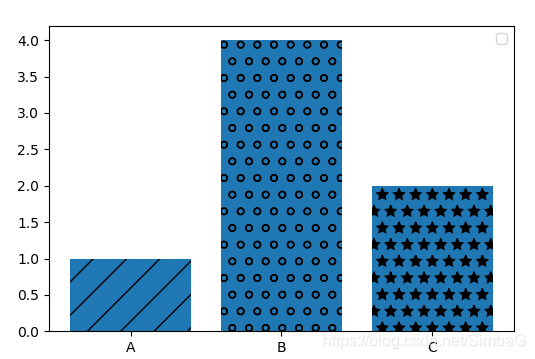
2.1 条形图
import matplotlib.pyplot as plt
import numpy as np
import pandas as pd

labels = ['A','B','C']
values = [1,4,2]

plt.figure(figsize=(6,4))

bars = plt.bar(labels,values)

# pop函数用于移除列表中的一个元素(默认最后一个元素),并且返回该元素的值。
patterns = ['/','o','*']
for bar in bars:
    bar.set_hatch(patterns.pop(0))
#bars[0].set_hatch('/')
#bars[1].set_hatch('o')
#bars[2].set_hatch('*')

plt.legend()
plt.show()
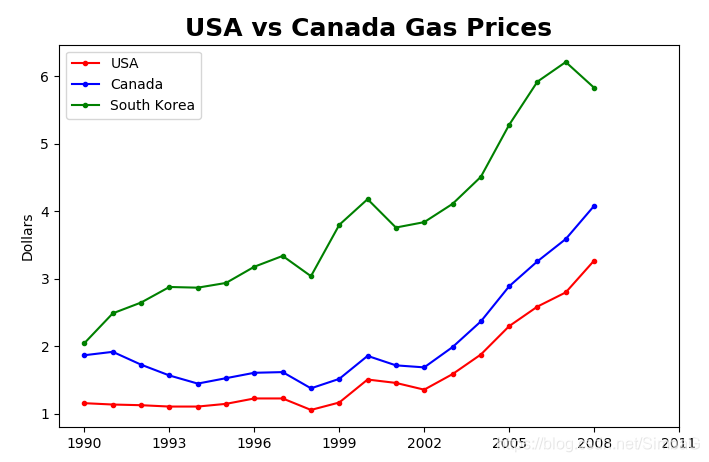
2.2 折线图
(1)
import matplotlib.pyplot as plt
import numpy as np
import pandas as pd

gas = pd.read_csv('gas_prices.csv')

plt.figure(figsize=(8,5))
plt.plot(gas.Year,gas.USA,'r.-',label='USA')
plt.plot(gas.Year,gas.Canada,'b.-',label='Canada')
plt.plot(gas['Year'],gas['South Korea'],'g.-',label='South Korea')

plt.title('USA vs Canada Gas Prices',fontdict={'fontweight':'bold','fontsize':18})
plt.ylabel('Dollars')
plt.xticks(gas.Year[::3].tolist()+[2011])

plt.legend()
plt.show()
 <
<
 最低0.47元/天 解锁文章


 5248
5248

 被折叠的 条评论
为什么被折叠?
被折叠的 条评论
为什么被折叠?
 到【灌水乐园】发言


