


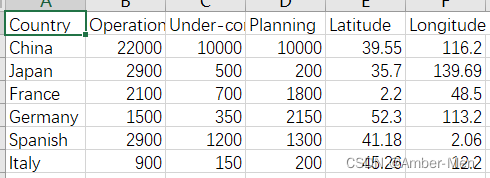
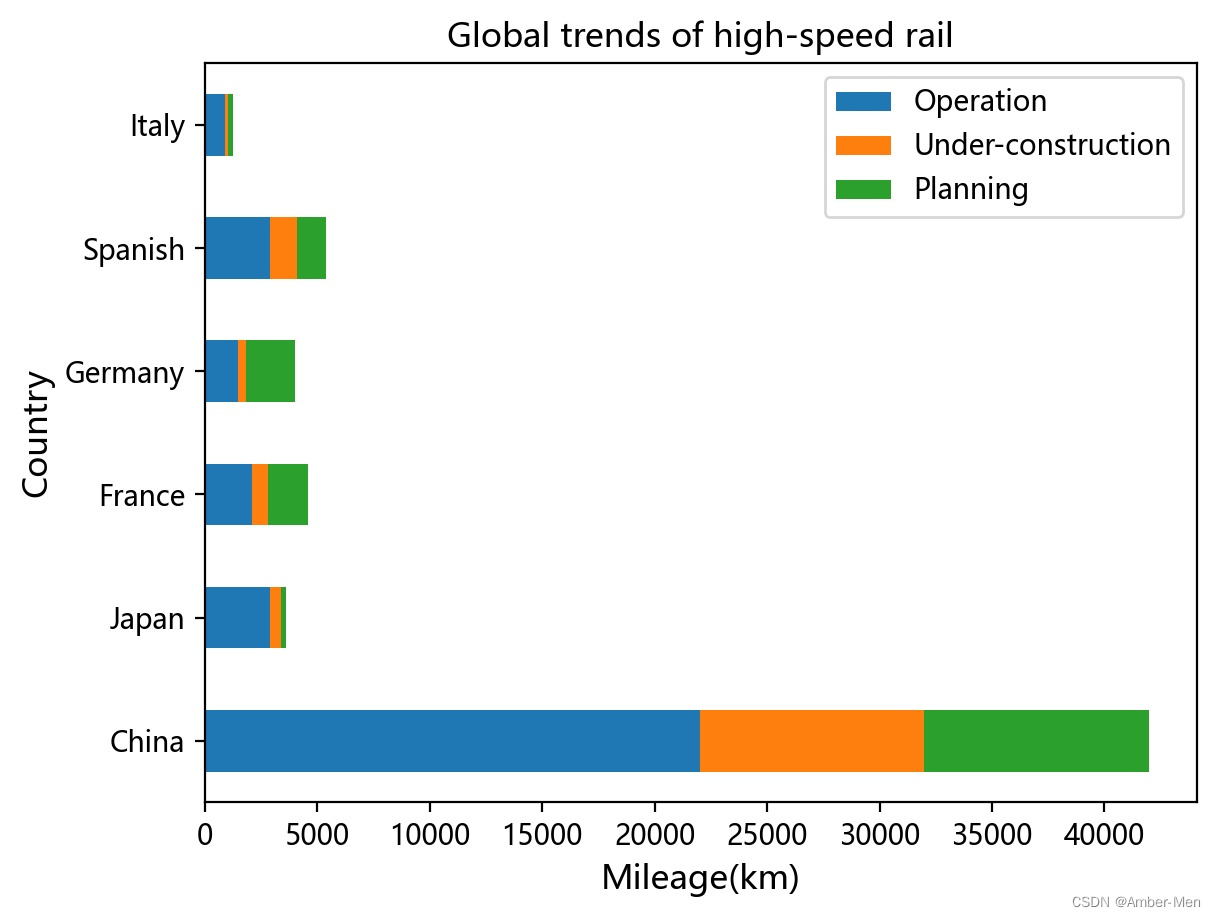
数据文件high-speed rail.csv存放着世界各国高速铁路的相关数据,要求画出各国运营里程现状和发展的堆叠柱状图。
数据如下:
一.使用DataFrame的plot方法(推荐)
data = pd.read_csv('High-speed rail.csv',index_col ='Country')
data1 = data[['Operation','Under-construction','Planning']]
data1.plot(kind='barh',use_index=True,stacked=True,title='Global trends of high-speed rail')
plt.xlabel('Mileage(km)',fontsize=12)
plt.ylabel('Country',fontsize=12)
plt.show()
二.使用plt.barh方法
data = pd.read_csv('High-speed rail.csv')

Operation = data['Operation']
Under_construction = data['Under-construction']
Planning = data['Planning']
Country = data['Country']

temp = []
for i in range(len(Operation)):
    sum = Operation[i] + Under_construction[i]
    temp.append(sum)

plt.barh(Country,Operation,label='Operation',height=0.5)
plt.barh(Country,Under_construction,left=Operation,label='Under_construction',height=0.5)
plt.barh(Country,Planning,left=temp,label='Planning',height=0.5)

plt.xlabel('Mileage(km)',fontsize=12)
plt.ylabel('Country',fontsize=12)
plt.title('Global trends of high-speed rail')
plt.legend()
plt.show()此方法源于https://blog.youkuaiyun.com/gtuif/article/details/89156771
三.结果展示
两种方法得出的结果几乎是一样的,如下图所示:


 4277
4277

 被折叠的 条评论
为什么被折叠?
被折叠的 条评论
为什么被折叠?
 到【灌水乐园】发言


