 Matlab中的信号处理:采样定理与滤波器应用


[Matlab-4]信号的采样与恢复(采样定理)
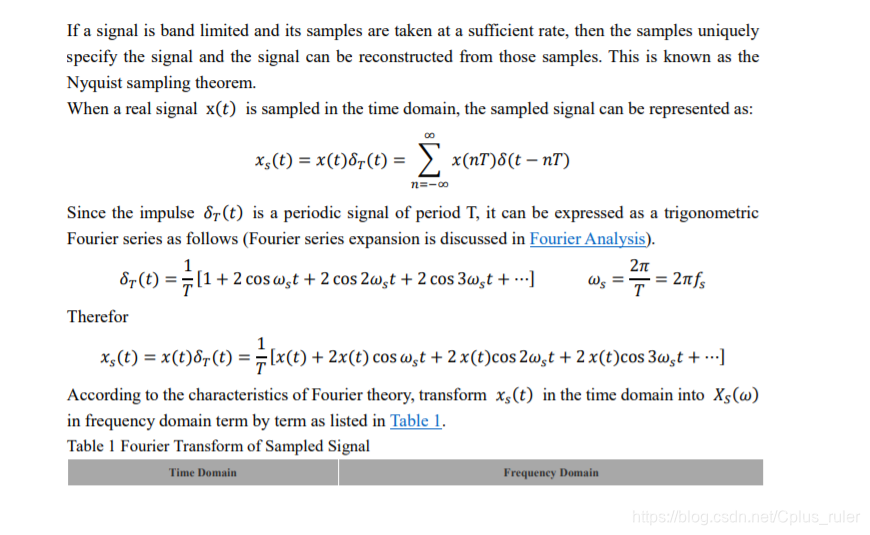
采样定理(Nyquist Sampling Theorem)
虽然对陶哲轩的压缩感知也非常感兴趣,但是,我们先来提一嘴采样定理。
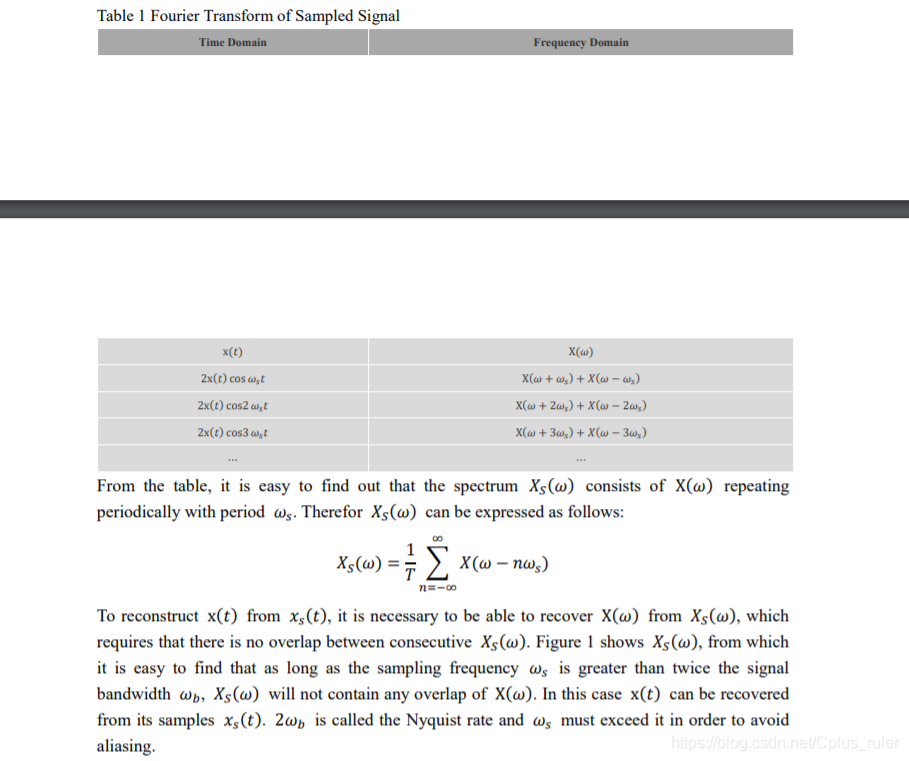
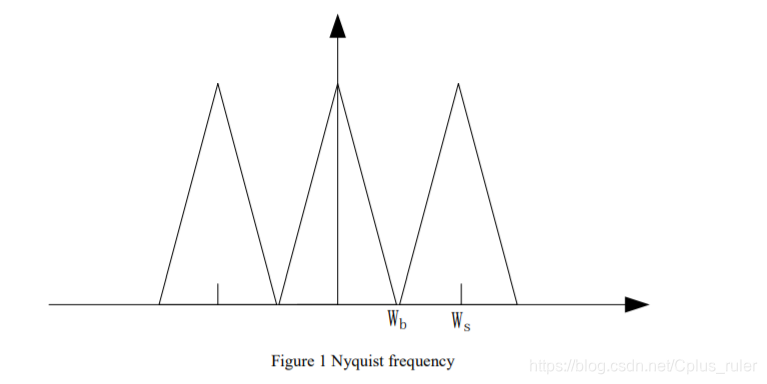
从这个图很容易看到,如果ws不是wb的至少两倍大,那么就会造成信号损失
移动平均滤波器(Moving-average filter)
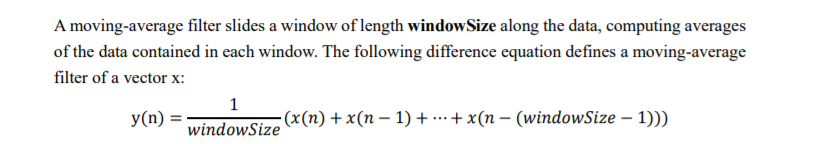
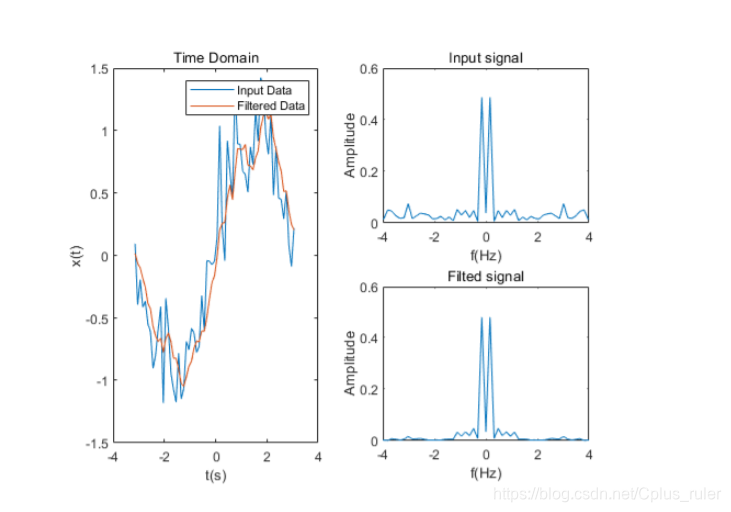
这里给一个 windowSize=5的例子
% signal with noise
clf;clear;
ds = 0.1;
Fs = 1/ds;
t = -pi:ds:pi;
x = sin(t)+0.25*randn(size(t));
N = length(x);
% set the filter
windowSize = 5;
b = (1/windowSize)*ones(1,windowSize);
a = 1;
% show the result in time domain
y = filter(b,a,x);
subplot(2,2,[1 3]);
plot(t,x); hold on;
plot(t,y); legend('Input Data','Filtered Data');
xlabel('t(s)');ylabel("x(t)");title('Time Domain')
% show the result in frequency domain
f = (-floor(N/2):floor(N/2))*Fs/N;
X = fftshift(fft(x))/N;
subplot(2,2,2); plot(f,abs(X)); axis([-4 4 0 0.6])
xlabel('f(Hz)');ylabel('Amplitude');title('Input signal');
Y = fftshift(fft(y))/N;
subplot(2,2,4); plot(f,abs(Y));axis([-4 4 0 0.6])
xlabel('f(Hz)');ylabel('Amplitude');title('Filted signal');
输出如下
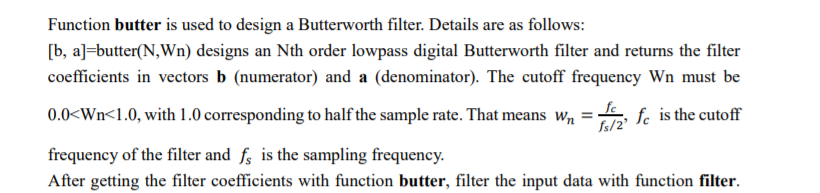
巴特沃斯滤波器(Butterworth filter)
% signal with noisy
% signal with noisy
clf; clear;
ds = 0.1;
fs = 1/ds;
t = -pi:ds:pi-ds;
x = sin(t)+0.25*randn(size(t));
fc = 0.5; % cutoff frequency
% set the filter
[b,a] = butter(4,fc/(fs/2));
[H w] = freqz(b,a);
plot(w/pi*fs/2,abs(H)); % the unit of the horizontal axis is *pi
rad/sample
xlim([0 1]);grid minor;title('Amplitude Response');
xlabel('Frequency (Hz)'); ylabel('Amplitude');
% show the result in time domain
y = filter(b,a,x);
subplot
最低0.47元/天 解锁文章


 1万+
1万+

 被折叠的 条评论
为什么被折叠?
被折叠的 条评论
为什么被折叠?
 到【灌水乐园】发言


