


 本文详细介绍Python中的字符串处理、布尔类型、数据转换、输入输出、运算符、列表操作等基础知识,适合初学者快速掌握Python核心语法。
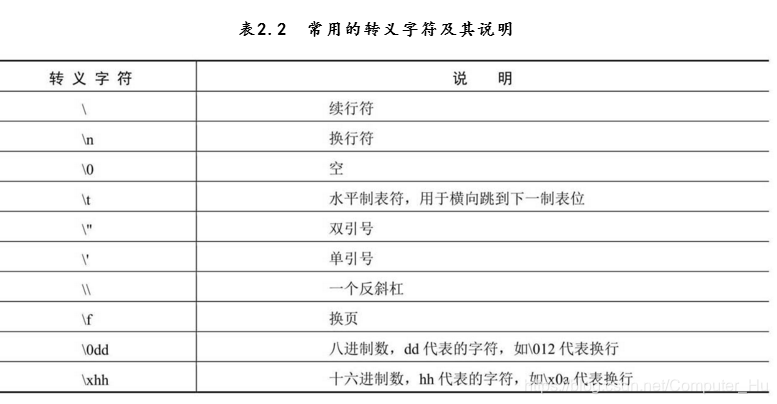
1.单引号、双引号字符串的内容必须在一行,三引号字符串可以是多行,表示复杂的字符时,可以使用引号嵌套。在字符串定界符引号前面加入r(R),字符串会原样输出,转义符无效。常用的转义字符如下图所示。
2. 布尔数据类型(Flase 或 Ture),并且布尔值可以转化为数值1或0;
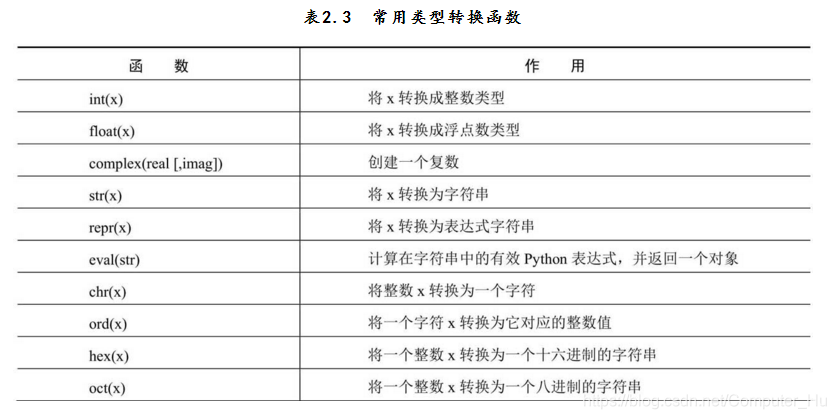
3.数据转换,python是一种弱语言,并不像java或c++语言那样变量必须要声明才可以使用,但仍然需要数据类型之间的转换,常用的数据类型的转换如下图所示。 非数字字符传
4.varible = input("请输入内容:"),input函数在python3.x中可直接输入数值或字符,print()打印输出函数可直接将字符或变量输出。默认为自动换行,如果不需要换行可将所要输出的内容用半角的英文逗号隔开。
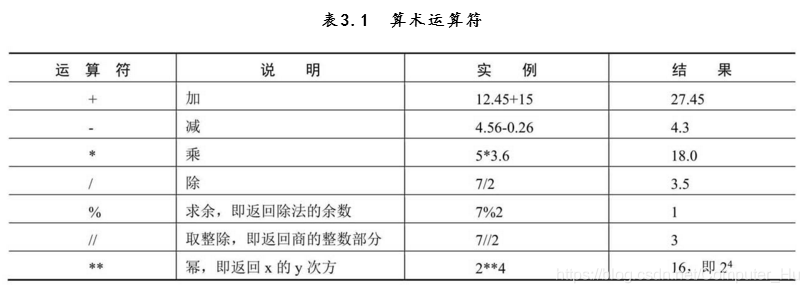
5.pyhon中的运算符及表达式,常见的 算术运算符:
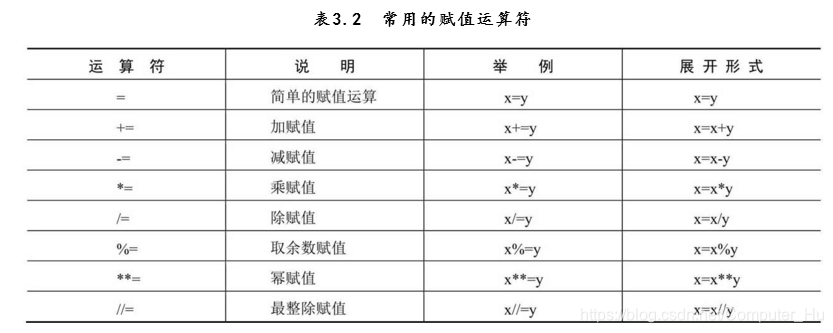
赋值运算:
位运算符:左移运算<<,左边溢出的位为0,右边空位补0。右移相反。
6.python 数据结构列表,a = [],末尾添加元素a.append(), a.insert(0,‘abc’)特殊的位置插入元素,del a[0]删除元素,弹出元素pop(),不知道位置坐标的情况下删除元素remove(‘ ’)。sort()函数对列表永久排序,sorted()列表临时排序,len()获取列表长度。
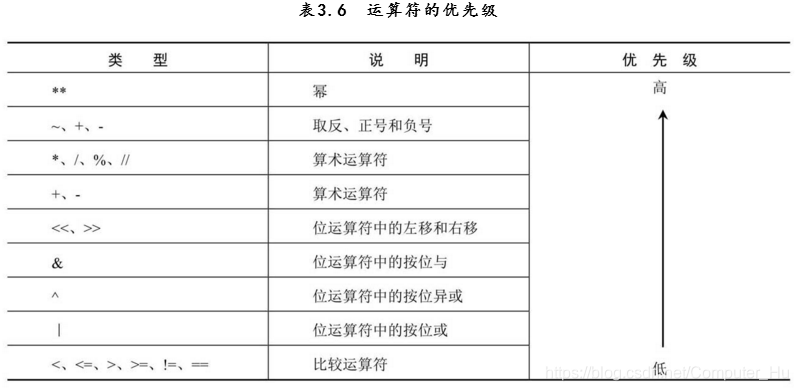
7.python运算符规则是:优先高级的运算先执行,优先级低的运算后执行, 同一优先级的操作。


 669
669

 被折叠的 条评论
为什么被折叠?
被折叠的 条评论
为什么被折叠?
 到【灌水乐园】发言


