


 本文介绍使用Matplotlib进行数据可视化的基础操作,包括如何绘制基本的线条图、设置线条样式、添加图例、标题和坐标轴标签等。此外还介绍了如何调整文字大小、设置图表大小及样式等高级技巧。
import numpy as np
import matplotlib.pyplot as plt
numbers = np.arange(10)
numbers
plt.plot(numbers,color=“r”,lw=2,linestyle = “-”,marker=‘D’)
lw 表示设置线条宽度,linestyle 表示设置线条类型,marker 设置 线条上点的形状
添加图例,即表示每条线具体代表什么
plt.legend(‘y’,fontsize=10)
显示标题
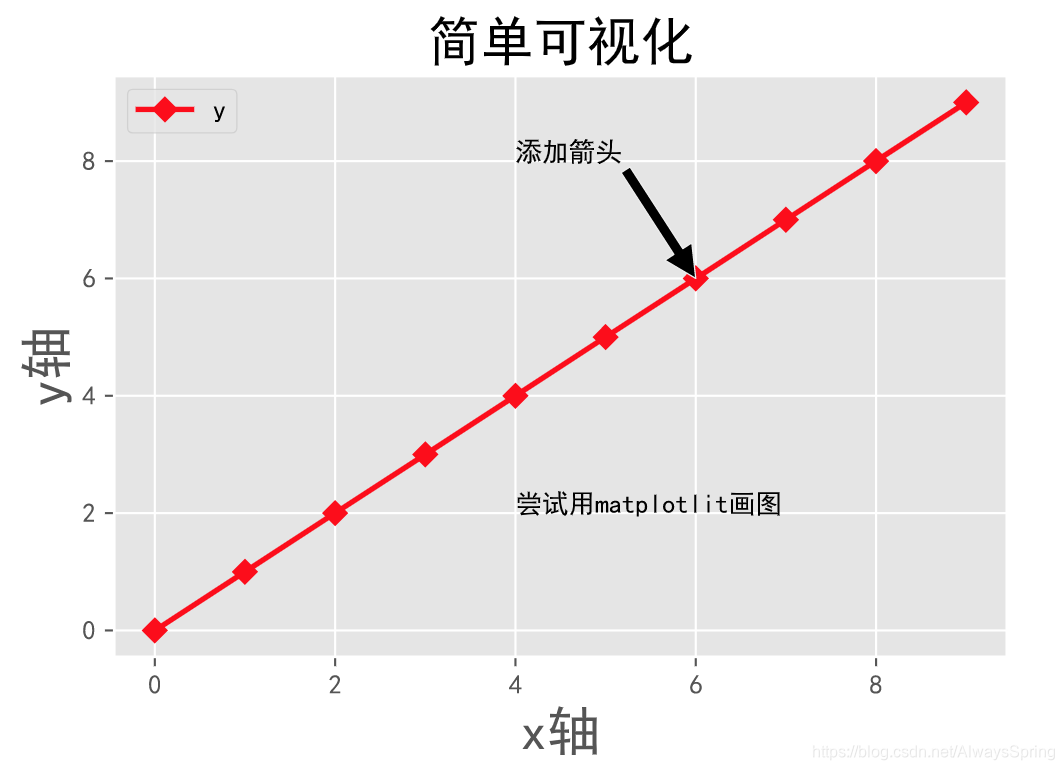
plt.title(‘简单可视化’,fontsize=20)
中文和负号的正常显示
plt.rcParams[‘font.sans-serif’] = [‘Microsoft Yahei’]
plt.rcParams[‘font.sans-serif’] = [‘SimHei’]
plt.rcParams[‘axes.unicode_minus’] = False
添加水平轴和垂直轴文字
plt.xlabel(“x轴”,fontsize=20)
plt.ylabel(‘y轴’,fontsize=20)
设置图形的显示风格
plt.style.use(“ggplot”)
在图中添加文字,并设置文字的位置
plt.annotate(‘尝试用matplotlib画图’,xy=(4,2),fontsize=10) #xy设置文字的添加位置, 4和8分别表示文字在x轴和y轴开始的位置
在图中添加箭头,并设置箭头的位置
plt.annotate(“添加箭头”,xy=(6,6),xytext=(4,8),arrowprops=dict(facecolor=‘black’),fontsize=10)
文本位置xytext,箭头终点xy,arrowprops 这个参数表示传入一个字典,表示箭头的颜色为黑色
#设置图表大小,(8,6)表示长乘宽
plt.figure(figsize=(8,6))
尺量图设置,展现出来的图片会比较清晰
%config InlineBackend.figure_format=‘svg’
设置文字大小,用fontsize 这个参数
根据上述参数画出来的图如下:
matplotlib 常用的基础线型
‘-’ solid line style
'–'dashed line style
‘-.’ dash-dot line style
‘:’ dotted line style
matplotlib 的marker参数选项
‘.’ point marker
‘,’ pixel marker
‘o’ circle marker
‘v’ triangle_down marker
'^'triangle_up marker
‘<’ triangle_left marker
‘>’ triangle_right marker
‘1’ tri_down marker
‘2’ tri_up marker
‘3’ tri_left marker
‘4’ tri_right marker
‘s’ square marker
‘p’ pentagon marker
‘*’ star marker
‘h’ hexagon1 marker
‘H’ hexagon2 marker
‘+’ plus marker
‘x’ x marker
‘D’ diamond marker
‘d’ thin_diamond marker
‘|’ vline marker
‘_’ hline marker


 4037
4037

 被折叠的 条评论
为什么被折叠?
被折叠的 条评论
为什么被折叠?
 到【灌水乐园】发言


