


title
title(sprintf("%d次拟合曲线", i))
title ( ['运行时间: ',num2str(i) ] );
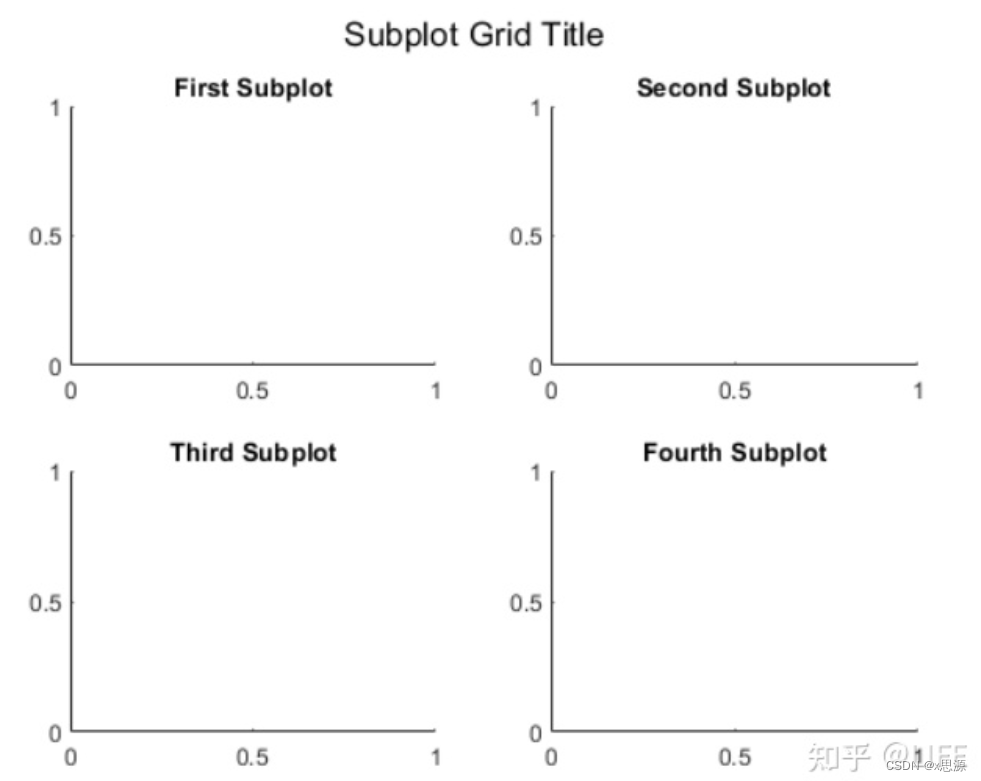
在subplot中加入大标题
转载自:https://zhuanlan.zhihu.com/p/500407309
subplot(2,2,1), title('First Subplot')
subplot(2,2,2), title('Second Subplot')
subplot(2,2,3), title('Third Subplot')
subplot(2,2,4), title('Fourth Subplot')

sgtitle('Subplot Grid Title') % 就是这个函数
marker
绘制对数图、设置线宽、符号大小和间隔
semilogy(x ,y,'k--s', 'LineWidth', 1.2,
			  'MarkerSize',8,
			  'MarkerIndices',1:3:length(x));
legend
需要添加latex公式:
legend({['$\Delta f_T = $',num2str(dfT1),'MHz'],
		['$\Delta f_T = $' ,num2str(dfT2),'MHz']},
		'Interpreter','latex');
需要修改legend位置
legend('sin(x)','cos(x)','Location','North');
加噪声
ys_add_noise=awgn(ys,snr);


 被折叠的 条评论
为什么被折叠?
被折叠的 条评论
为什么被折叠?
 到【灌水乐园】发言


