


先读取数据和查看数据的总体情况
import pandas as pd
data = pd.read_csv('data.csv')
print(data.info())

<class 'pandas.core.frame.DataFrame'>
RangeIndex: 7500 entries, 0 to 7499
Data columns (total 18 columns):
 #   Column                        Non-Null Count  Dtype
---  ------                        --------------  -----
 0   Id                            7500 non-null   int64
 1   Home Ownership                7500 non-null   object
 2   Annual Income                 5943 non-null   float64
 3   Years in current job          7129 non-null   object
 4   Tax Liens                     7500 non-null   float64
 5   Number of Open Accounts       7500 non-null   float64
 6   Years of Credit History       7500 non-null   float64
 7   Maximum Open Credit           7500 non-null   float64
 8   Number of Credit Problems     7500 non-null   float64
 9   Months since last delinquent  3419 non-null   float64
 10  Bankruptcies                  7486 non-null   float64
 11  Purpose                       7500 non-null   object
 12  Term                          7500 non-null   object
 13  Current Loan Amount           7500 non-null   float64
 14  Current Credit Balance        7500 non-null   float64
 15  Monthly Debt                  7500 non-null   float64
 16  Credit Score                  5943 non-null   float64
 17  Credit Default                7500 non-null   int64
dtypes: float64(12), int64(2), object(4)
将Home Ownership 和 Years in current job 转化为数字
先了解特征的分布情况,用字典映射转化类型
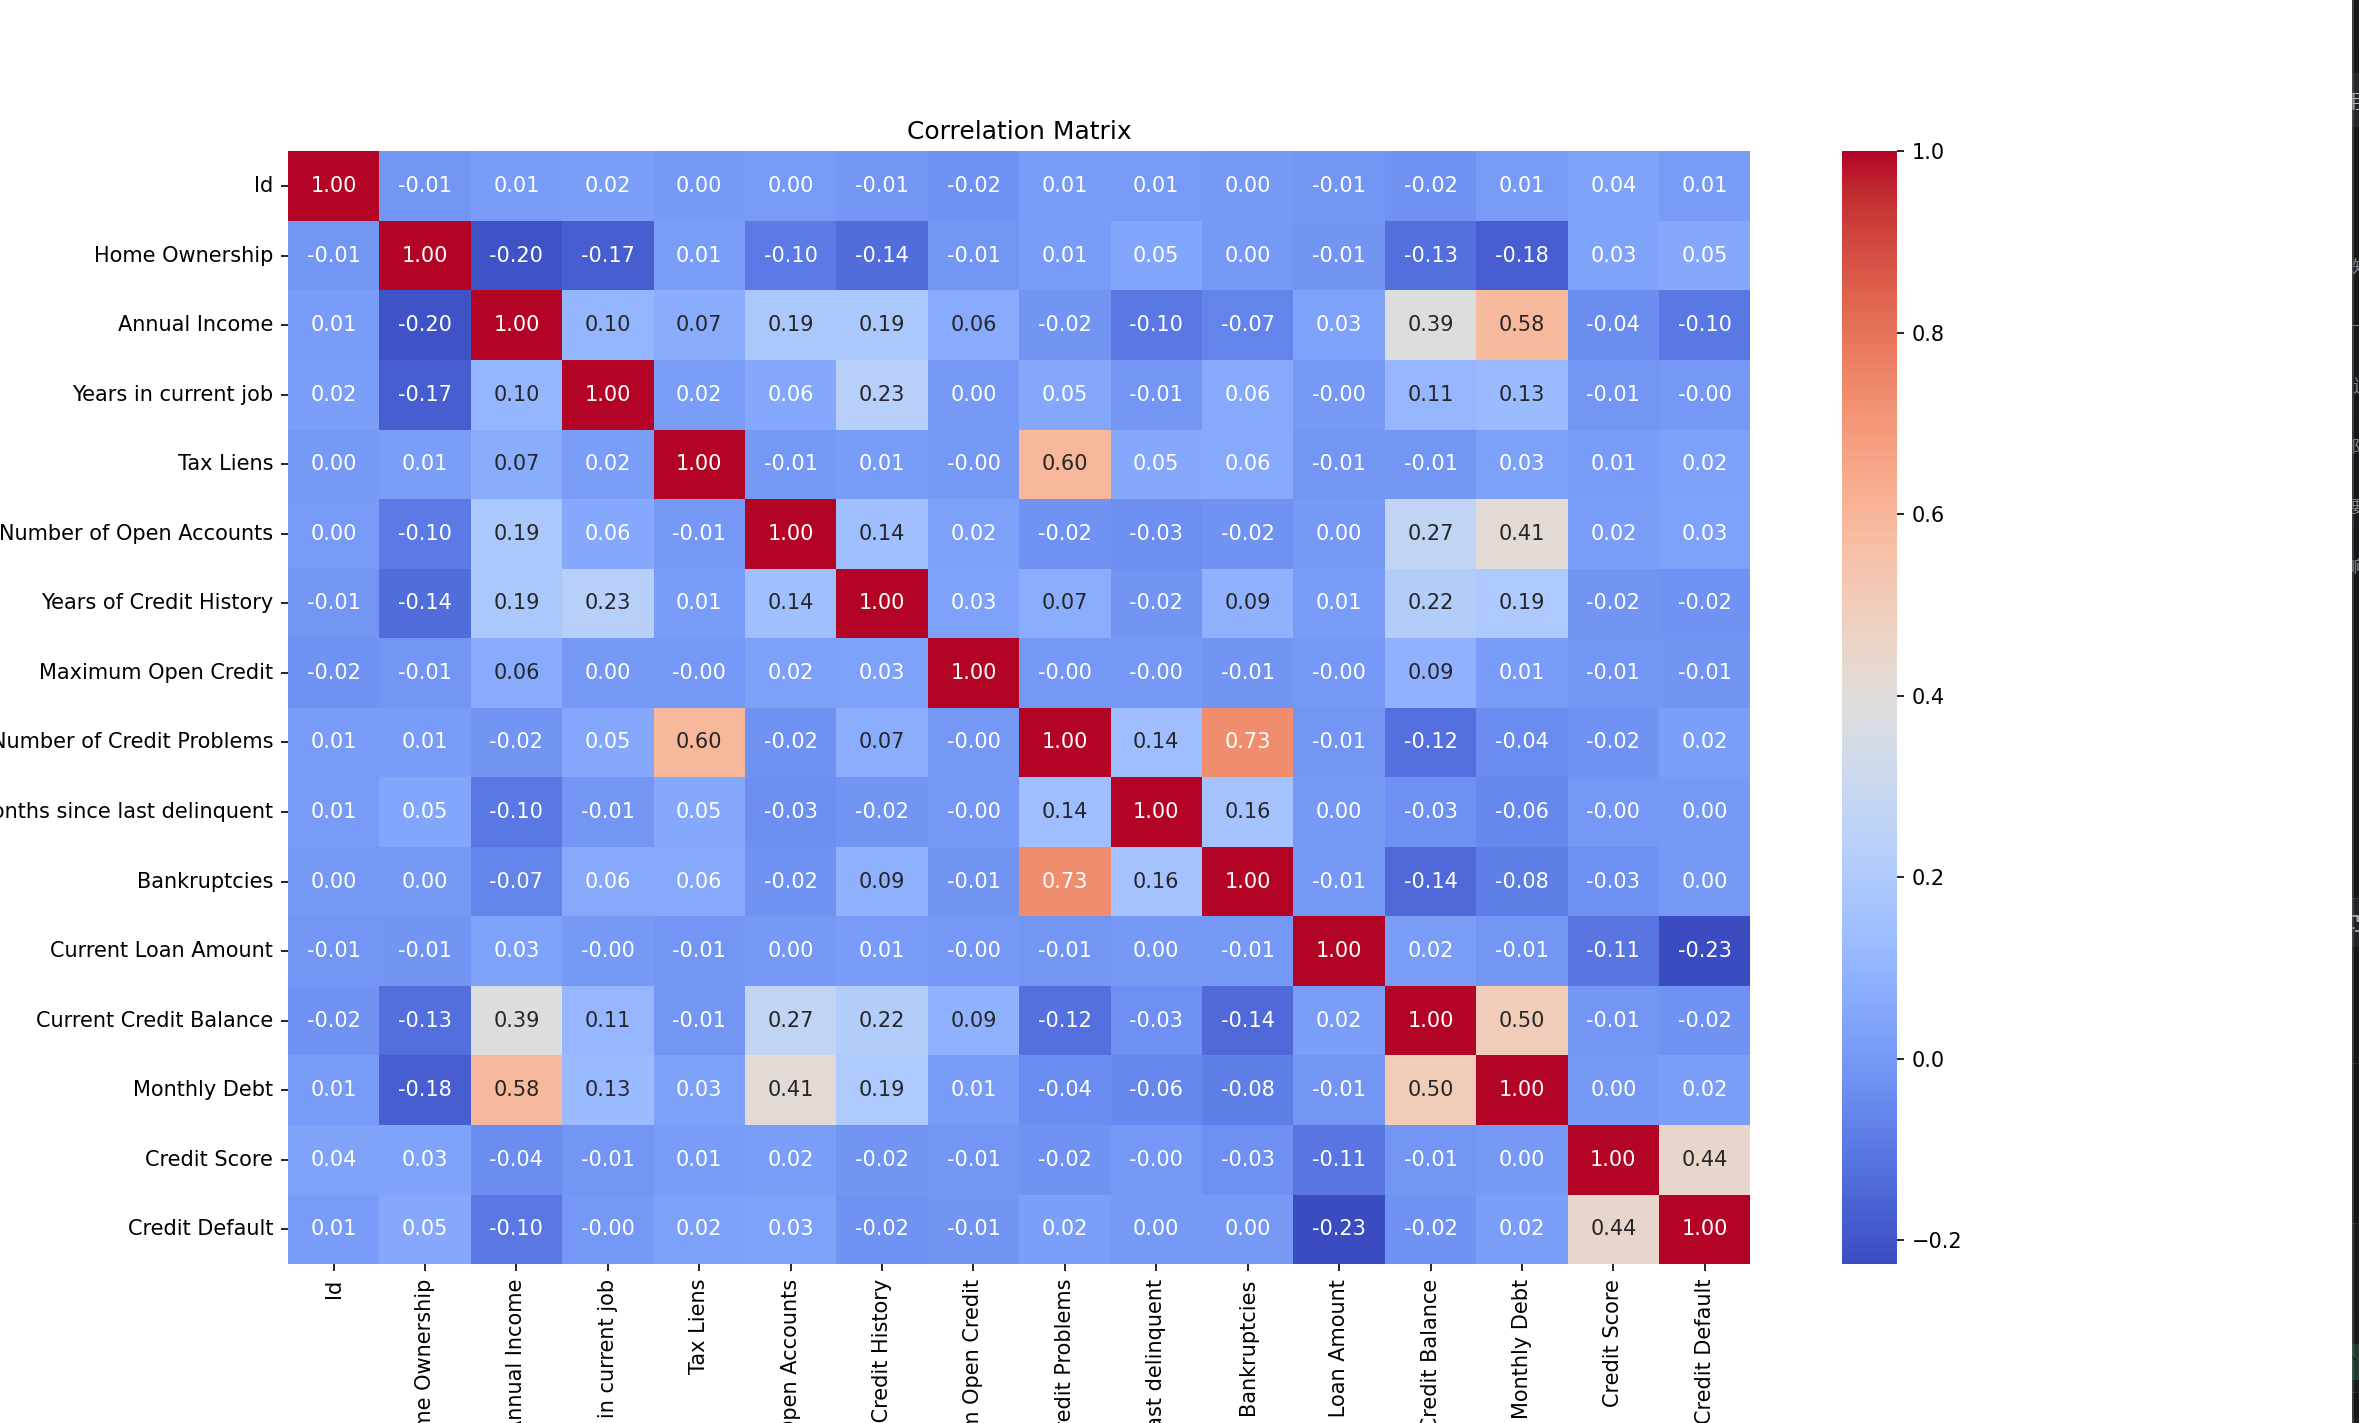
# 提取连续特征,计算相关系数,绘图
continue_feature = []
for feature in data.columns:
    if data[feature].dtype != 'object':
        continue_feature.append(feature)
# 计算相关系数
corr_matrix = data[continue_feature].corr()
# 绘制相关系数矩阵的热力图
plt.figure(figsize=(16, 10))
sns.heatmap(corr_matrix, annot=True, cmap='coolwarm', fmt=".2f")
plt.title("Correlation Matrix")
plt.show()
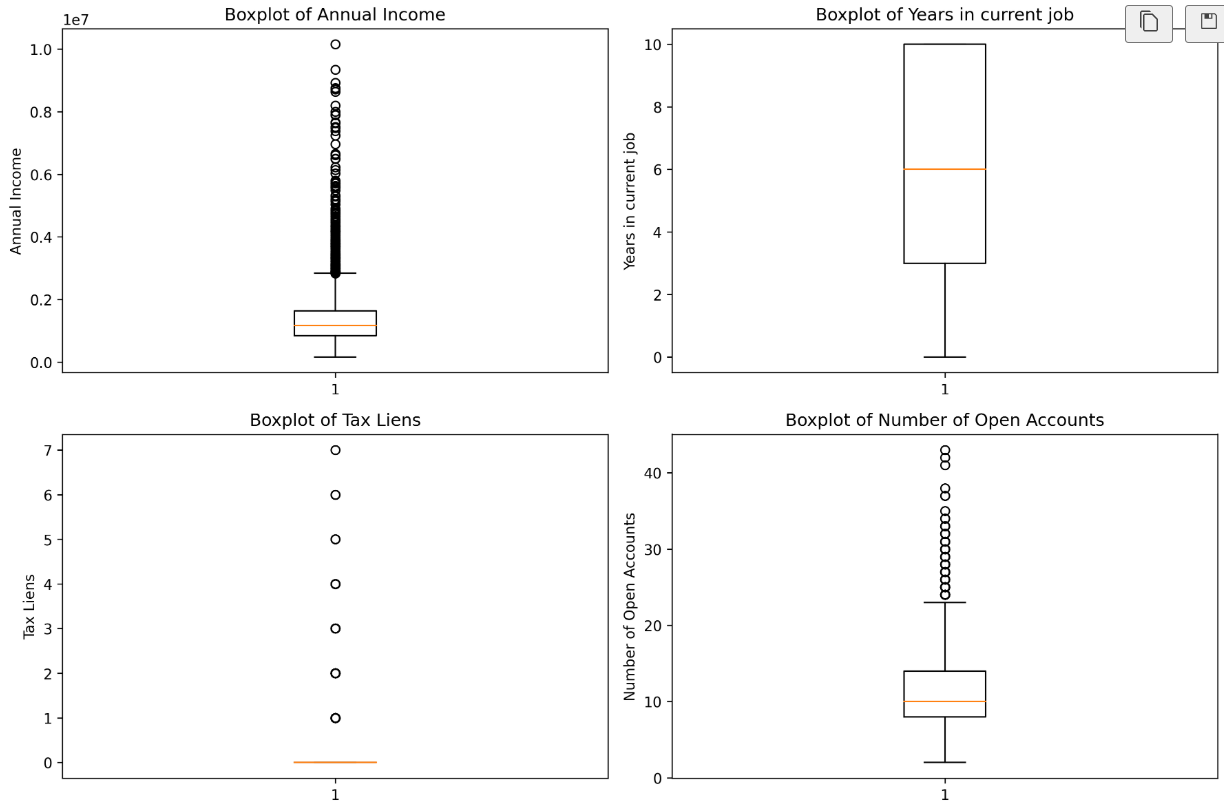
features = ['Annual Income', 'Years in current job', 'Tax Liens', 'Number of Open Accounts']
plt.rcParams['figure.dpi'] = 300
fig, axes = plt.subplots(2, 2, figsize=(12, 8))
# 使用 for 循环遍历特征
for i in range(len(features)):
    row = i // 2 # 计算当前特征在子图中的行索引,// 是整除,即取整 ,之所以用整除是因为我们要的是行数
    # 例如 0//2=0, 1//2=0, 2//2=1, 3//2=1
    col = i % 2 # 计算当前特征在子图中的列索引,% 是取余,即取模
    # 例如 0%2=0, 1%2=1, 2%2=0, 3%2=1
    # 绘制箱线图
    feature = features[i]
    axes[row, col].boxplot(data[feature].dropna())
    axes[row, col].set_title(f'Boxplot of {feature}')
    axes[row, col].set_ylabel(feature)
plt.tight_layout()
plt.show()
enumerate()函数:
enumerate()函数返回一个迭代对象,该对象包含索引和值。
语法:
enumerate(iterable, start=0)
参数:
iterable -- 迭代对象,迭代对象可以是列表、元组、字典、字符串等。
start -- 索引的开始值
返回值:
返回一个迭代对象,该对象包含索引和值。
之所以这个函数很有用,是因为它允许我们同时迭代一个序列,并获取每个元素的索引和值。
今日状态一般般,明天再认真跑一下,今天绘制子图时出现不少问题,明天尝试解决


 431
431

 被折叠的 条评论
为什么被折叠?
被折叠的 条评论
为什么被折叠?
 到【灌水乐园】发言


