<template>
<chart style="width:100%; height:100px;"
:options="orgOptions"
:auto-resize="true"></chart>
</template>
<script>
import echarts from 'echarts'
export default {
name: 'barChartGDYJ',
data () {
return {
orgOptions: {}
}
},
methods: {
getInfoSucc () {
this.orgOptions = {
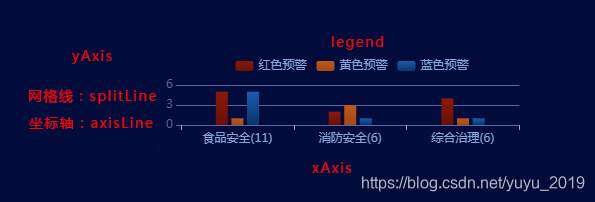
legend: {
itemWidth: 18,
itemHeight: 10,
textStyle: {
color: '#85a6db'
}
},
tooltip: {},
grid: {
left: '0%',
right: '5%',
top: '30%',
bottom: '10%',
containLabel: true
},
dataset: {
source: [
['product', '红色预警', '黄色预警', '蓝色预警'],
['食品安全(11)', 5, 1, 5],
['消防安全(6)', 2, 3, 1],
['综合治理(6)', 4, 1, 1]
]
},
xAxis: {
type: 'category',
axisLine: {
lineStyle: {
color: '#85a6db',
width: 0
}
}
},
yAxis: {
min: 0,
max: 6,
splitNumber: 2,
interval: 3,
axisLine: {
lineStyle: {
color: '#5767a0',
width: 0
}
},
splitLine: {
show: true,
lineStyle: {
color: '#5767a0',
width: 1
}
}
},
series: [
{
type: 'bar',
barWidth: 12,
itemStyle: {
normal: {
color: new echarts.graphic.LinearGradient(
0, 0, 0, 1,
[
{ offset: 0, color: '#8b1909' },
{ offset: 1, color: '#691004' }
]
)
}
}
},
{
type: 'bar',
barWidth: 12,
itemStyle: {
normal: {
color: new echarts.graphic.LinearGradient(
0, 0, 0, 1,
[
{ offset: 0, color: '#c1571a' },
{ offset: 1, color: '#a44813' }
]
)
}
}
},
{
type: 'bar',
barWidth: 12,
itemStyle: {
normal: {
color: new echarts.graphic.LinearGradient(
0, 0, 0, 1,
[
{ offset: 0, color: '#195cad' },
{ offset: 1, color: '#09356b' }
]
)
}
}
}
]
}
}
},
mounted () {
this.getInfoSucc()
}
}
</script>
<style scoped>
</style>


 被折叠的 条评论
为什么被折叠?
被折叠的 条评论
为什么被折叠?
 到【灌水乐园】发言


