


 该代码示例展示了一个基于Qt的主窗口应用,利用QCustomPlot库创建了一个图形,通过QTimer定时器每隔一定时间添加新的数据点,动态更新曲线图。X轴数据为递增数值除以5减去10,Y轴数据为X的立方。当数据点超过100个时,定时器停止。此外,还设置了坐标轴的标签、颜色和字体大小,以及图形的背景色和曲线颜色。
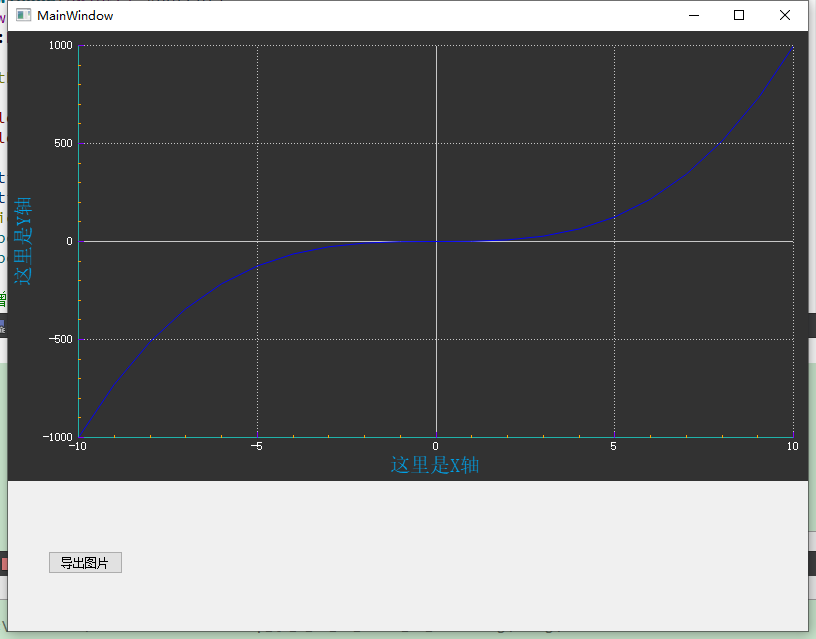
开启一个定时器,来模拟实时新增的数据,直接看结果。
#ifndef MAINWINDOW_H
#define MAINWINDOW_H

#include <QCustomPlot.h>
#include <QMainWindow>

QT_BEGIN_NAMESPACE
namespace Ui { class MainWindow; }
QT_END_NAMESPACE

class MainWindow : public QMainWindow
{
    Q_OBJECT

public:
    MainWindow(QWidget *parent = nullptr);
    ~MainWindow();

private slots:
    void on_pushButton_clicked();

private:
    Ui::MainWindow *ui;

    QCustomPlot *pCustomPlot;
    QCPGraph *pGraph;

    // 可变数组存放绘图的坐标的数据,分别存放x和y坐标的数据
    QVector<double> x, y;
};
#endif // MAINWINDOW_H
#include "mainwindow.h"
#include "qcustomplot.h"
#include "ui_mainwindow.h"


MainWindow::MainWindow(QWidget *parent)
    : QMainWindow(parent)
    , ui(new Ui::MainWindow)
{
    ui->setupUi(this);

        pCustomPlot = new QCustomPlot(this);
        pCustomPlot->resize(800, 450);

        QTimer *timer = new QTimer();
        connect(timer,&QTimer::timeout,this,[=](){
            static int number = 0;
            x.append(number/5 - 10);
            y.append(qPow(x[number], 3));  // x的y次方;

            //每增加一个数据,都需要setData一次
            pGraph->setData(x,y);

            //设置Y轴自适应,不能只设置一次自适应,每增加一个数据,都需要设置一下自适应
            pGraph->rescaleValueAxis(true, true);//y的极大值显示出来
            pGraph->rescaleAxes();//y轴自适应

            pCustomPlot->replot();//刷新图像
            ++number;
            if(number>100)
            {
                timer->stop();
            }
        });
        timer->start(100);


        // 向绘图区域QCustomPlot添加一条曲线
        pGraph = pCustomPlot->addGraph();

        // 设置坐标轴名称
        pCustomPlot->xAxis->setLabel("这里是X轴");
        pCustomPlot->yAxis->setLabel("这里是Y轴");

        // 设置背景色
        pCustomPlot->setBackground(QColor(50, 50, 50));

        //画出的曲线的颜色
        pGraph->setPen(QPen(QColor(0, 0, 250)));

        // 设置x/y轴文本色、轴线色、字体等
        pCustomPlot->xAxis->setTickLabelColor(Qt::white);
        pCustomPlot->xAxis->setLabelColor(QColor(0, 160, 230));
        pCustomPlot->xAxis->setBasePen(QPen(QColor(32, 178, 170)));
        pCustomPlot->xAxis->setTickPen(QPen(QColor(128, 0, 255)));
        pCustomPlot->xAxis->setSubTickPen(QColor(255, 165, 0));
        QFont xFont = pCustomPlot->xAxis->labelFont();
        xFont.setPixelSize(20);
        pCustomPlot->xAxis->setLabelFont(xFont);

        pCustomPlot->yAxis->setTickLabelColor(Qt::white);
        pCustomPlot->yAxis->setLabelColor(QColor(0, 160, 230));
        pCustomPlot->yAxis->setBasePen(QPen(QColor(32, 178, 170)));
        pCustomPlot->yAxis->setTickPen(QPen(QColor(128, 0, 255)));
        pCustomPlot->yAxis->setSubTickPen(QColor(255, 165, 0));
        QFont yFont = pCustomPlot->yAxis->labelFont();
        yFont.setPixelSize(20);
        pCustomPlot->yAxis->setLabelFont(yFont);

        // 设置坐标轴显示范围,否则只能看到默认范围
//        pCustomPlot->xAxis->setRange(-11, 11);
//        pCustomPlot->yAxis->setRange(-1100, 1100);
}

MainWindow::~MainWindow()
{
    delete ui;
}


void MainWindow::on_pushButton_clicked()
{
    pCustomPlot->savePng("img/abc.png",400,300);
}


 3110
3110

 被折叠的 条评论
为什么被折叠?
被折叠的 条评论
为什么被折叠?
 到【灌水乐园】发言


