1.快速生成曲线
# Pyplot
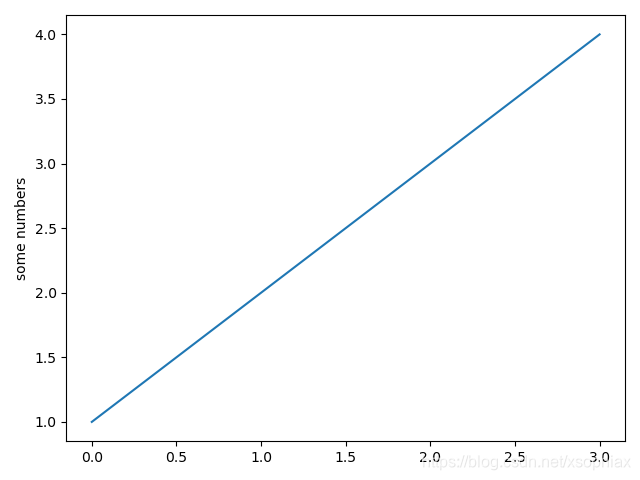
import matplotlib.pyplot as plt
plt.plot([1, 2, 3, 4])
plt.ylabel('some numbers')
plt.show()
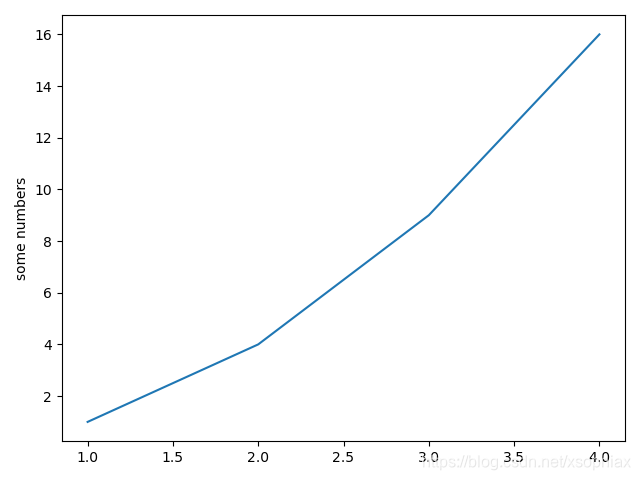
import matplotlib.pyplot as plt
plt.plot([1, 2, 3, 4], [1, 4, 9, 16])
plt.ylabel('some numbers')
plt.show()
'''
Formatting the style of your plot
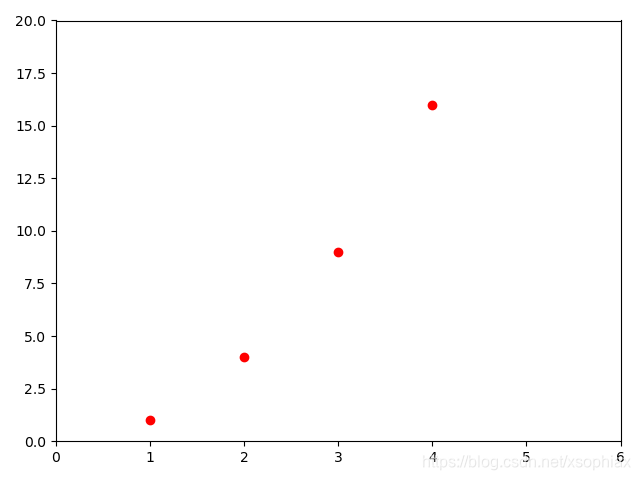
For every x, y pair of arguments, there is an optional third argument which is the format string that indicates the color and line type of the plot. The letters and symbols of the format string are from MATLAB, and you concatenate a color string with a line style string. The default format string is 'b-', which is a solid blue line. For example, to plot the above with red circles, you would issue
'''
import matplotlib.pyplot as plt
plt.plot([1, 2, 3, 4], [1, 4, 9, 16], 'ro')
plt.axis([0, 6, 0, 20])
plt.show()
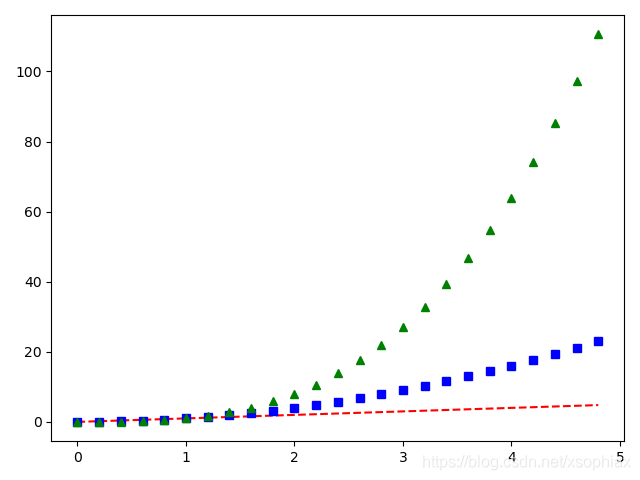
import numpy as np
import matplotlib.pyplot as plt

# evenly sampled time at 200ms intervals
t = np.arange(0., 5., 0.2)

# red dashes, blue squares and green triangles
plt.plot(t, t, 'r--', t, t**2, 'bs', t, t**3, 'g^')
plt.show()


 648
648

 被折叠的 条评论
为什么被折叠?
被折叠的 条评论
为什么被折叠?
 到【灌水乐园】发言


