


 本文介绍了如何在Python中安装matplotlib和Pygal。通过在PyCharm中搜索并安装这两个包,实现了matplotlib的基础应用,包括绘制随机漫步图。此外,还简单介绍了Pygal的安装和使用,通过实例展示了Pygal对多次骰子投掷结果的统计和美观的可视化效果。
Python中的matplotlib与Pygal的安装、使用与实例
matplotlib的安装
要进行绘图方面的编程,首先要有关于绘图的包,原装的python一般不带有这个包,所以需要自己额外下载。网上看了很多教程,但是都无法成功下载,自己误打误撞安装成功了,给读者安利一下。
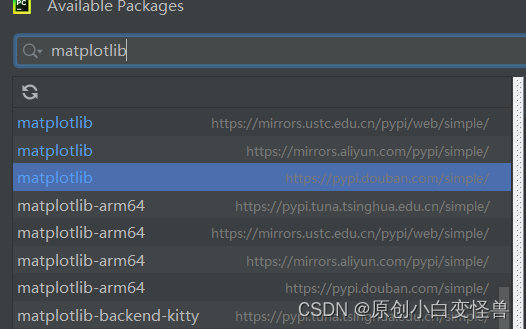
首先打开pycharm,file–>settings,然后如图所示
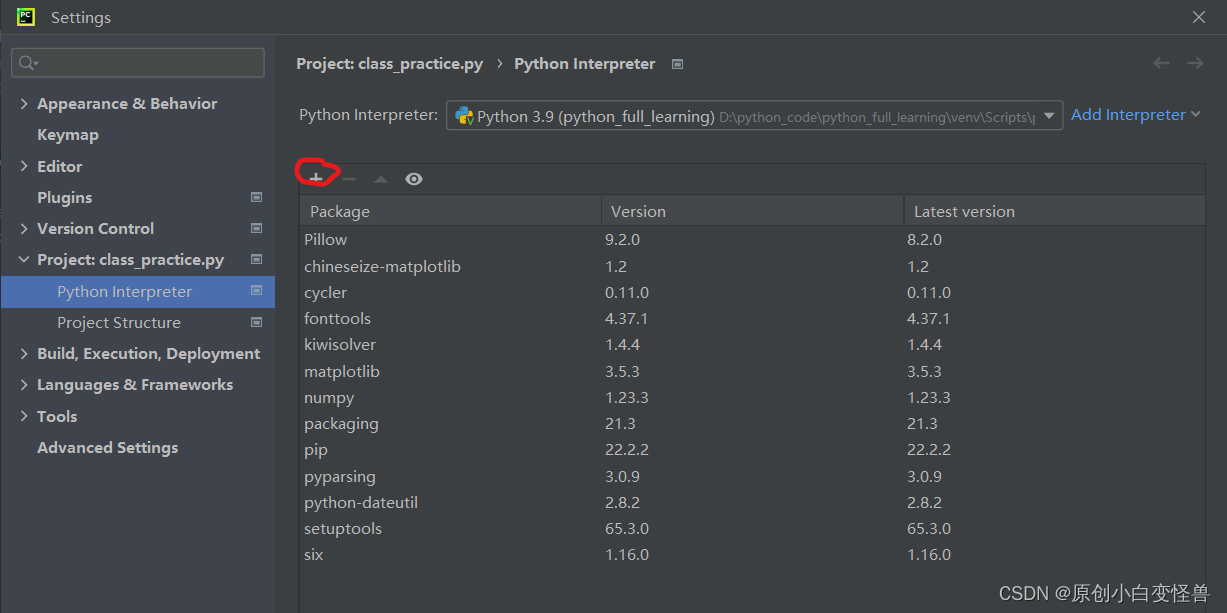
在搜索框内搜索matplotlib,点击下方的install package即可,如果还不能成功import,再重新打开一次idle即可。至此,绘图的matplotlib包就安装好啦。
matplotlib的基础与运用(随机漫步图)
matplotlib初体验,绘制简单折线图
import matplotlib.pyplot as plt
squares = [1,4,9,16,25]
plt.plot(squares)
plt.show()
标签和线条粗细
squares = [1,4,9,16,25]
plt.plot(squares,linewidth = 5)
# 设置标题,坐标并加上标签
plt.title("Square Numbers",fontsize = 24)
plt.xlabel("Value",fontsize = 14)
plt.ylabel("Square of value",fontsize = 14)
plt.tick_params(axis='both',labelsize = 14)
plt
最低0.47元/天 解锁文章


 1823
1823


 到【灌水乐园】发言


