


一、使用matplotlib模拟掷骰子
在matplotlib的模块pyplot中,可以通过bar函数来创建柱形图
# 模拟掷骰子
from die import Die
import matplotlib.pyplot as plt
# 创建一个D6
die = Die()
# 掷几次骰子, 并将结果存储在一个列表中
results = []
for roll_num in range(1000):
result = die.roll()
results.append(result)
# 分析结果
frequencies = []
for value in range(1, die.num_sides+1):
frequency = results.count(value)
frequencies.append(frequency)
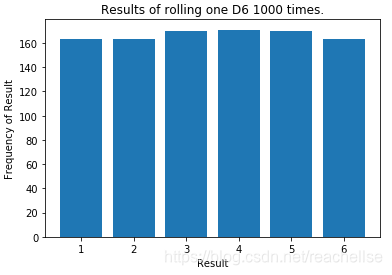
# 对结果进行可视化
plt.bar(list(range(1, die.num_sides+1)), frequencies)
plt.title( "Results of rolling one D6 1000 times.")
plt.xlabel("Result")
plt.ylabel("Frequency of Result")
二、使用pygal模拟随机漫步
pygal官网中也有相关的图例,发现必须使用字典的形式才能作图,自己采用字典形式时发生了一些错误导致无法做图,后来在网上查找了大佬的一些文章,纠正后成功制作出了正确的图表。
我做了以下修改:1.采用collections中的OrderedDict来创建一个有序字典,2.通过嵌套的方式,将创建的实例中的x,y坐标值作为该字典的值,3.最后通过列表解析的方式遍历该字典中的值。
 最低0.47元/天 解锁文章


 625
625

 被折叠的 条评论
为什么被折叠?
被折叠的 条评论
为什么被折叠?
 到【灌水乐园】发言


