import pandas as pd
import matplotlib.pyplot as plt
from matplotlib.font_manager import FontProperties
# 设置新宋体字体的路径
font_path = 'D:/reportlab/simsun/simsun.ttf'
# 加载新宋体字体
prop = FontProperties(fname=font_path)
"""
# 读取 xlsx 文件
df = pd.read_excel('your_excel_file.xlsx')
# 假设 xlsx 文件包含两列,一列是类别,一列是数值
categories = df['Category'].tolist()
values = df['Value'].tolist()
"""
#以上是自己的数据,可以加上这个。
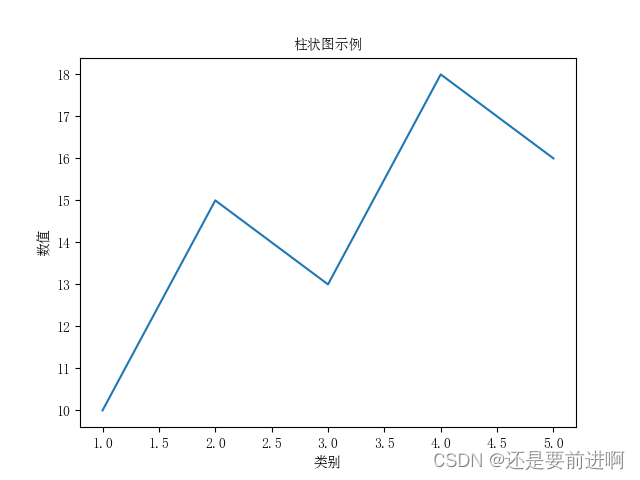
categories = [1, 2, 3, 4, 5]
values = [10, 15, 13, 18, 16]
# 创建柱状图,并设置颜色
plt.plot(categories, values)
# 添加标题和标签,并使用新宋体字体
plt.title('柱状图示例', fontproperties=prop)
plt.xlabel('类别', fontproperties=prop)
plt.ylabel('数值', fontproperties=prop)
# 设置刻度字体
plt.xticks(fontproperties=prop)
plt.yticks(fontproperties=prop)
# 显示图形
plt.show()


 被折叠的 条评论
为什么被折叠?
被折叠的 条评论
为什么被折叠?
 到【灌水乐园】发言


