


 本文介绍了如何利用docker在Ubuntu环境中安装和配置Prometheus、Grafana以及node_exporter,实现服务器监控。首先确保docker环境,然后分别拉取并运行Prometheus和Grafana的镜像,接着安装node_exporter收集服务器指标。配置Prometheus的配置文件,使其连接node_exporter。最后在Grafana中添加Prometheus数据源并导入仪表板模板,完成监控平台的搭建。
一、环境要求
1、docker安装docker环境
2、docker安装prometheus
3、docker安装grafana
4、node-exportor(安装在被测服务器上)
5、我的服务器是Ubuntu
二、docker 安装prometheus
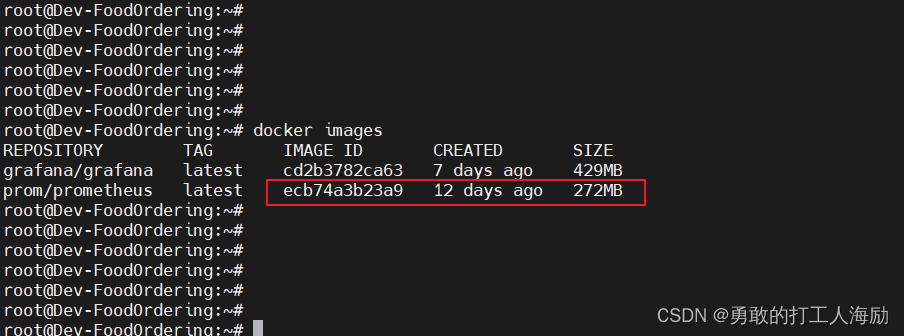
1、下载Prometheus镜像
docker pull prom/prometheus
2、检查端口是否被占用
安装netstat命令
sudo apt update
sudo apt install net-tools
netstat -tuln | grep 9090
或者使用ss命令
ss -tuln | grep 9090
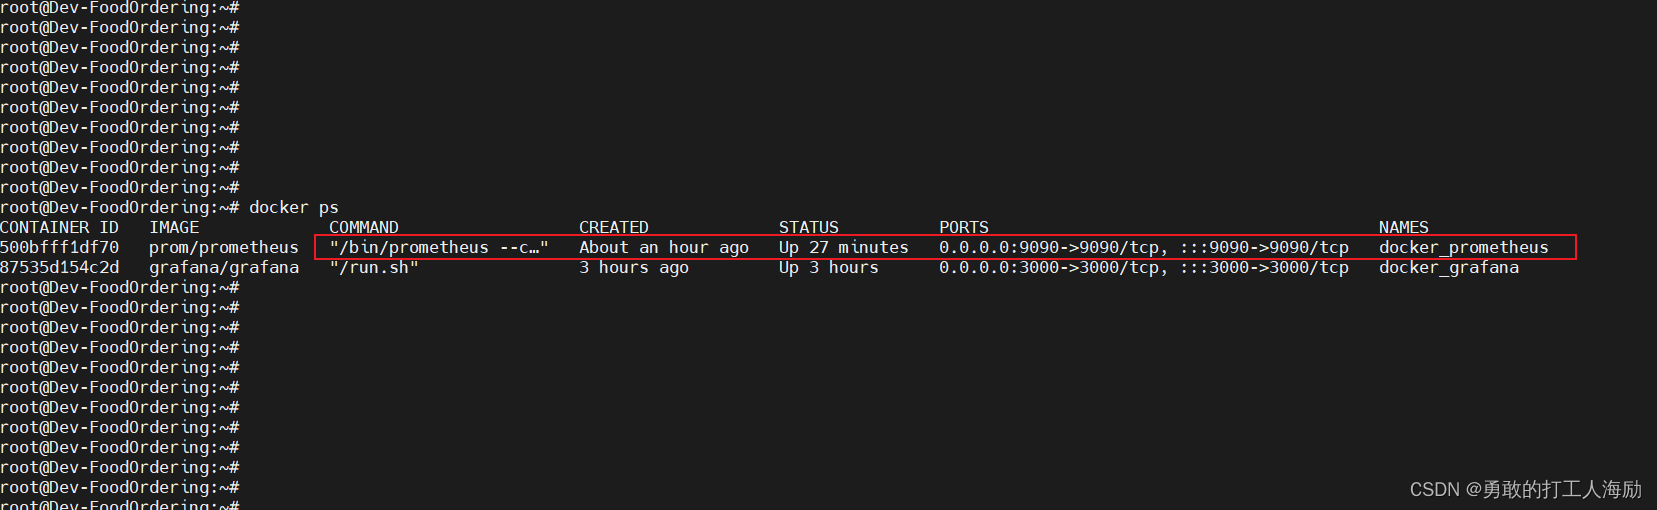
3、创建Prometheus容器
docker run -dit --name=docker_prometheus --restart=always -p 9090:9090 prom/prometheus
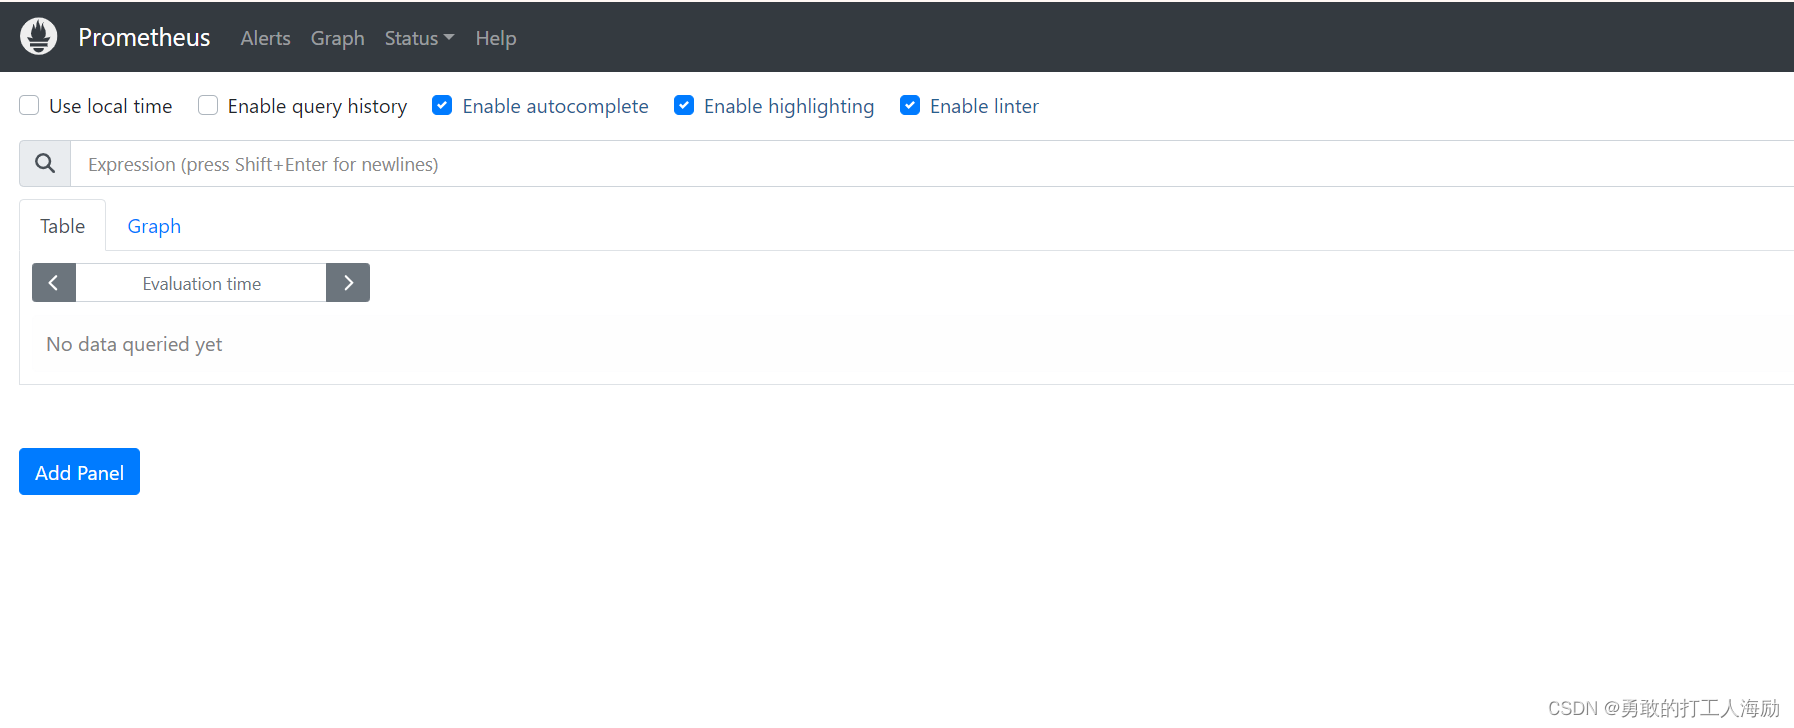
4、访问
http://ip:9090
三、docker安装grafana
1、下载镜像
docker pull grafana/grafana
2、端口检测
netstat -tuln | grep 9090
3、创建容器
如果只是短暂使用可以不映射目录到宿主机
docker run -dit --name=docker_grafana --restart=always -p 3000:3000 -v $PWD/grafana-storage:/var/lib/grafana grafana/grafana
docker run -dit --name=docker_grafana --restart=always -p 3000:3000 grafana/grafana
4、访问
默认账号密码:admin/admin
http://ip:3000
四、docker安装node_export
1、下载安装包
https://github.com/prometheus/node_exporter/releases
wget https://github.com/prometheus/node_exporter/releases/download/v1.8.0/node_exporter-1.8.0.linux-amd64.tar.gz
2、解压
tar -zxvf node_exporter-1.8.0.linux-amd64.tar.gz
3、直接启动
nohup ./node_exporter &
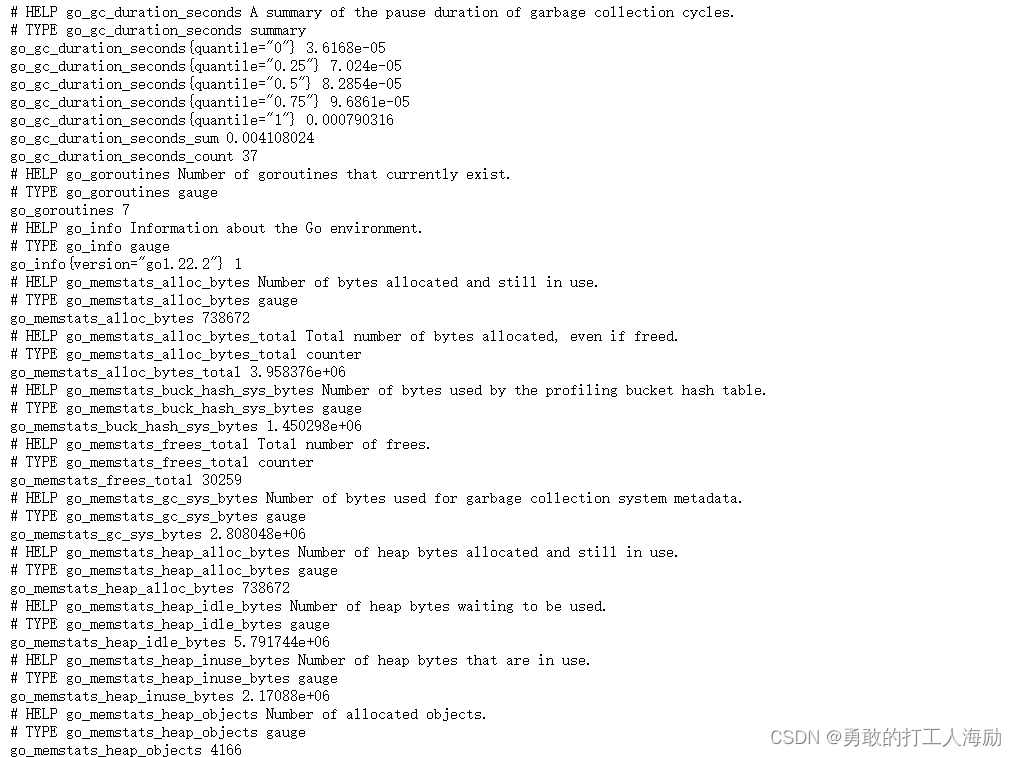
4、访问
http://ip:9100/metrics
五、配置Prometheus+node_exporter
1、prometheus本身没有数据收集功能,需要用node_exporter收集
2、修改Prometheus的配置文件,这个文件在Prometheus容器的 /etc/prometheus/prometheus.yml
3、从Prometheus容器中拷贝配置文件到宿主机
docker cp docker_prometheus:/etc/prometheus/prometheus.yml $PWD
4、yml文件的编辑,注意格式,否则启动会报错
vim prometheus.yml
5、我的应用宿主机没有docker,懒得装了,直接解压使用了
# my global config
global:
  scrape_interval: 5s # Set the scrape interval to every 15 seconds. Default is every 1 minute.
  evaluation_interval: 5s # Evaluate rules every 15 seconds. The default is every 1 minute.
  # scrape_timeout is set to the global default (10s).

# Alertmanager configuration
alerting:
  alertmanagers:
    - static_configs:
        - targets:
          # - alertmanager:9093

# Load rules once and periodically evaluate them according to the global 'evaluation_interval'.
rule_files:
  # - "first_rules.yml"
  # - "second_rules.yml"

# A scrape configuration containing exactly one endpoint to scrape:
# Here it's Prometheus itself.
scrape_configs:
  # The job name is added as a label `job=<job_name>` to any timeseries scraped from this config.
  - job_name: "prometheus"

    # metrics_path defaults to '/metrics'
    # scheme defaults to 'http'.

    static_configs:
      - targets: ["localhost:9090"]

  - job_name: "node_exporter"
    static_configs:
      - targets: ["192.168.15.170:9100"]
        labels:
            instance: node1
5、把修改后的配置文件拷贝到Prometheus容器中
docker cp $PWD/prometheus.yml docker_prometheus:/etc/prometheus/prometheus.yml
6、重启prometheus容器
docker restart docker_prometheus
六、配置Grafana+Prometheus
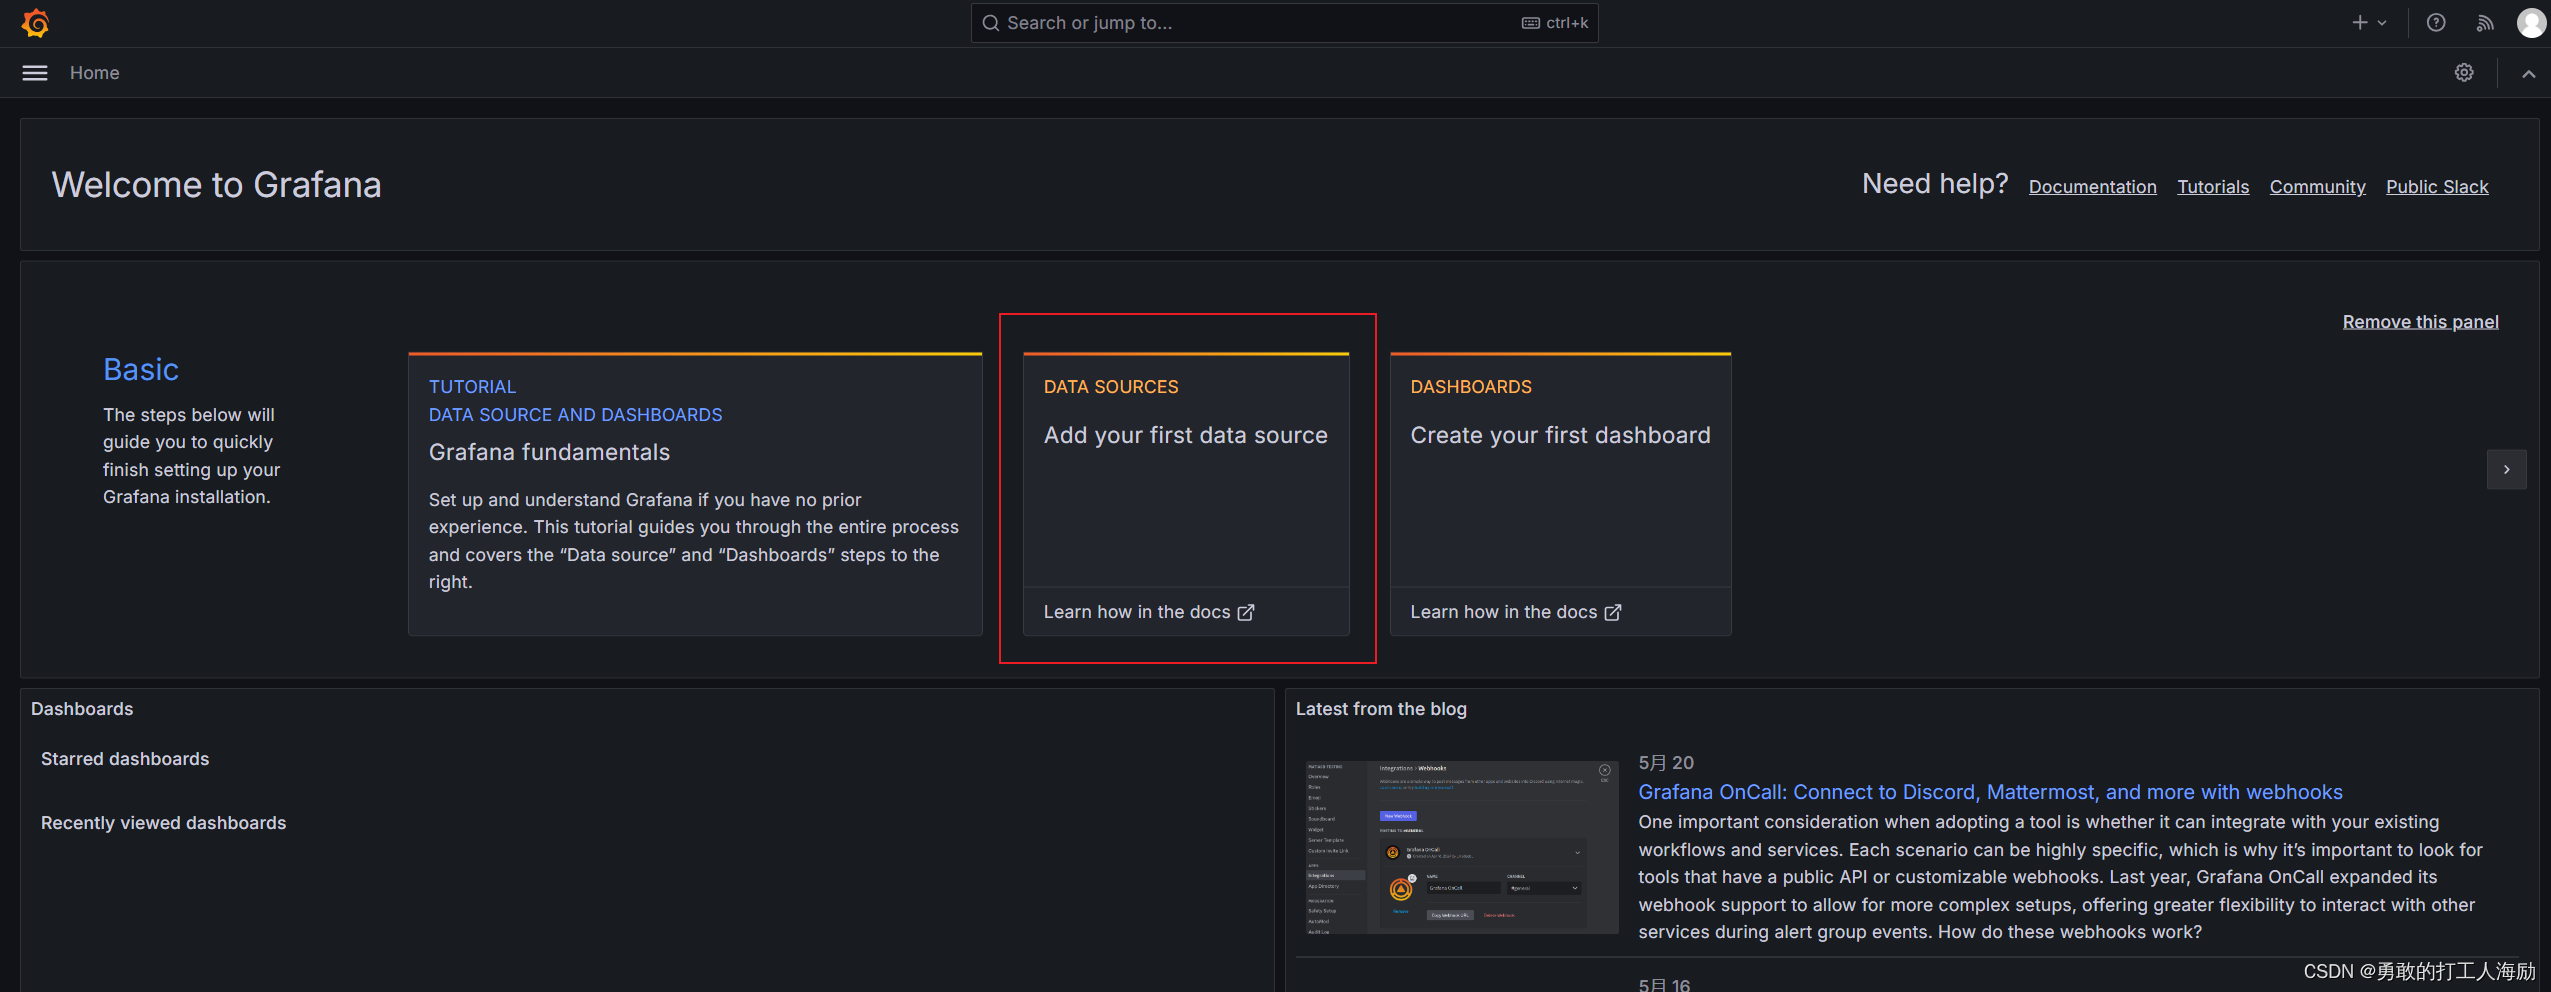
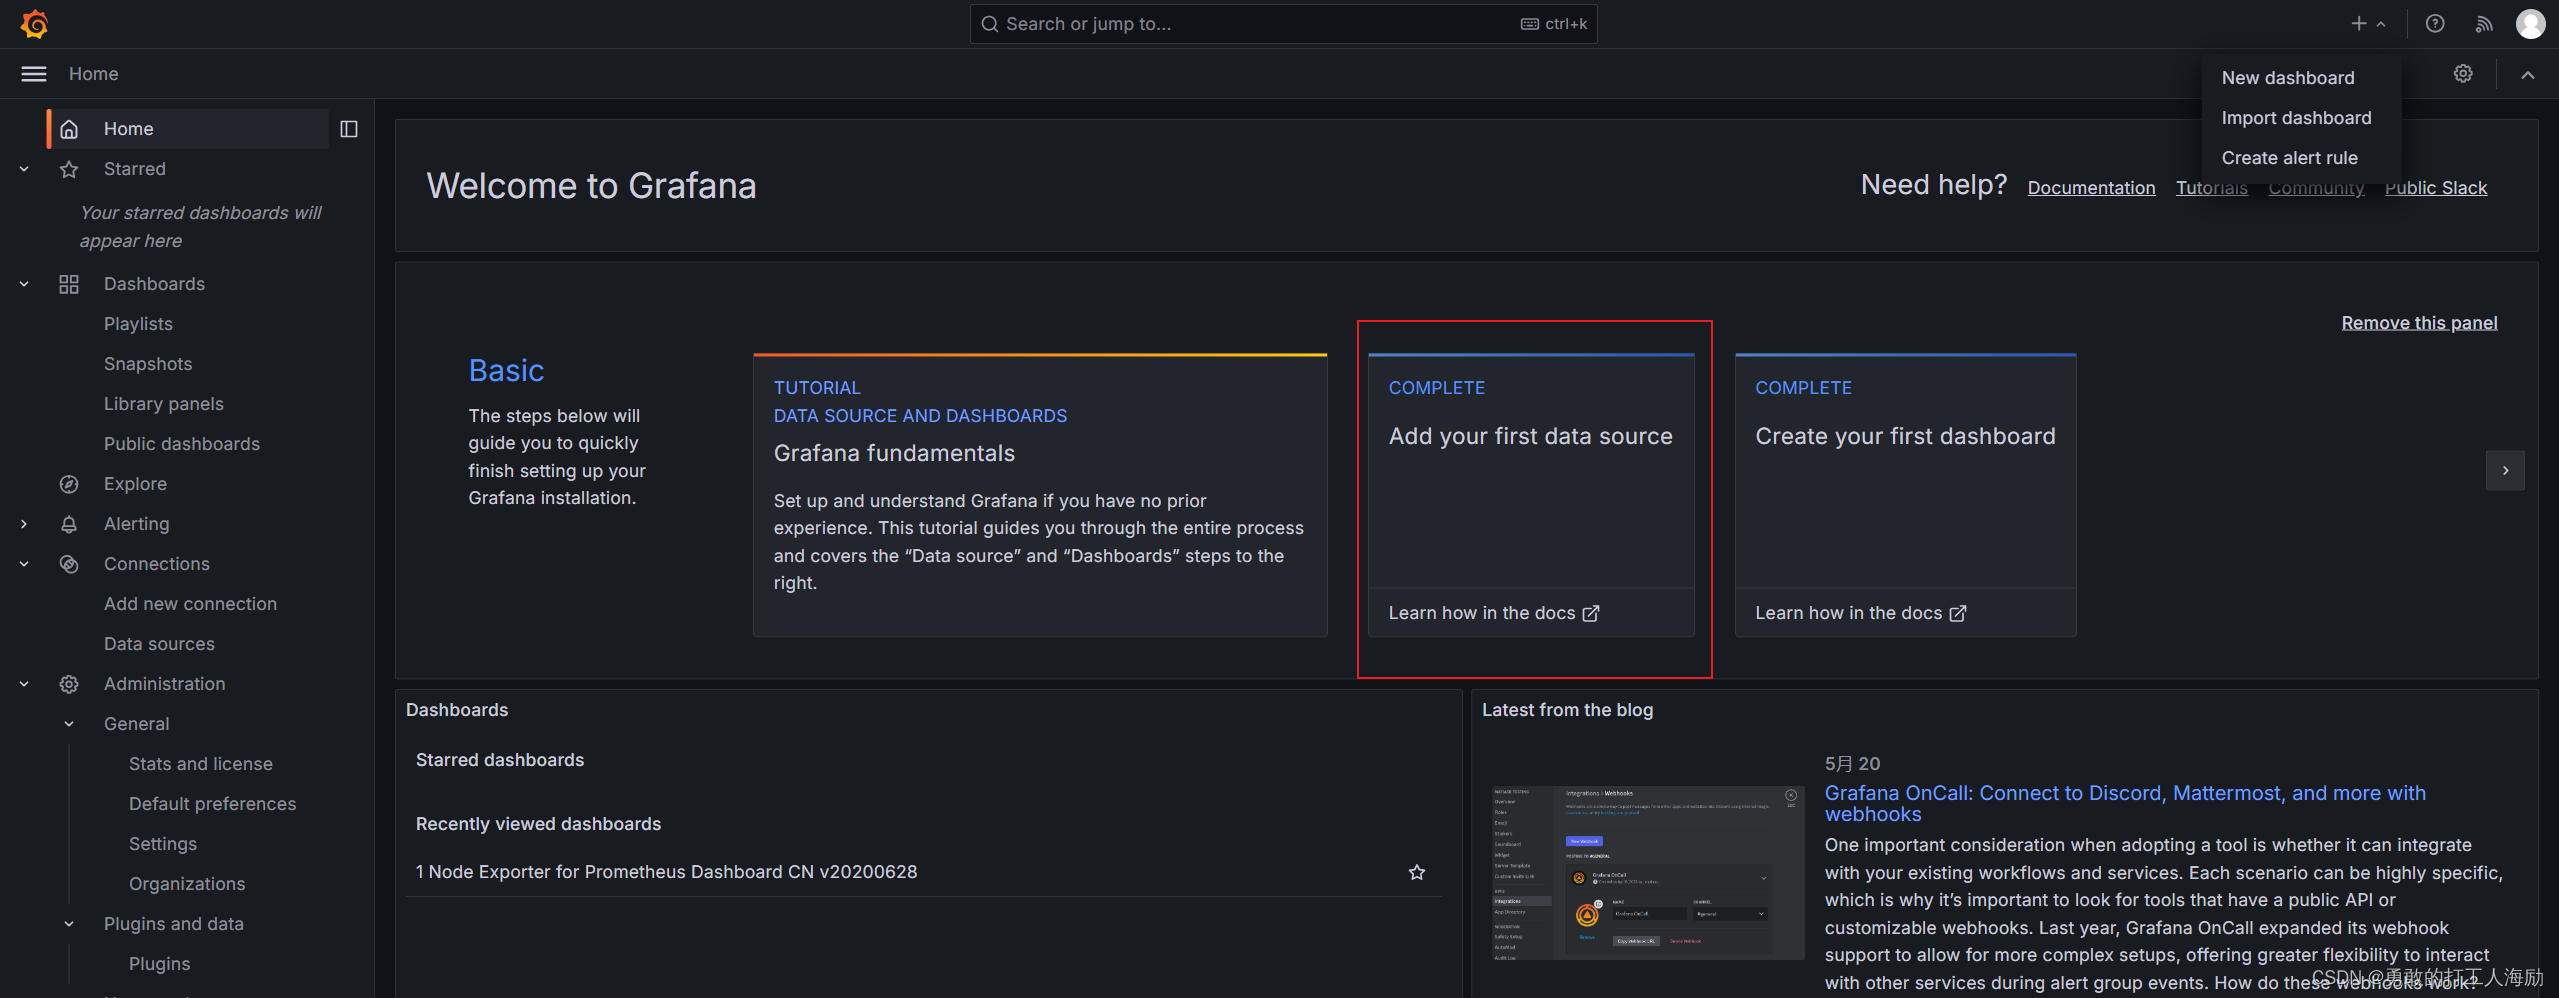
1、访问Grafana
http://Ip:3000
2、登录后,在首页,选择 “Add your first data source”
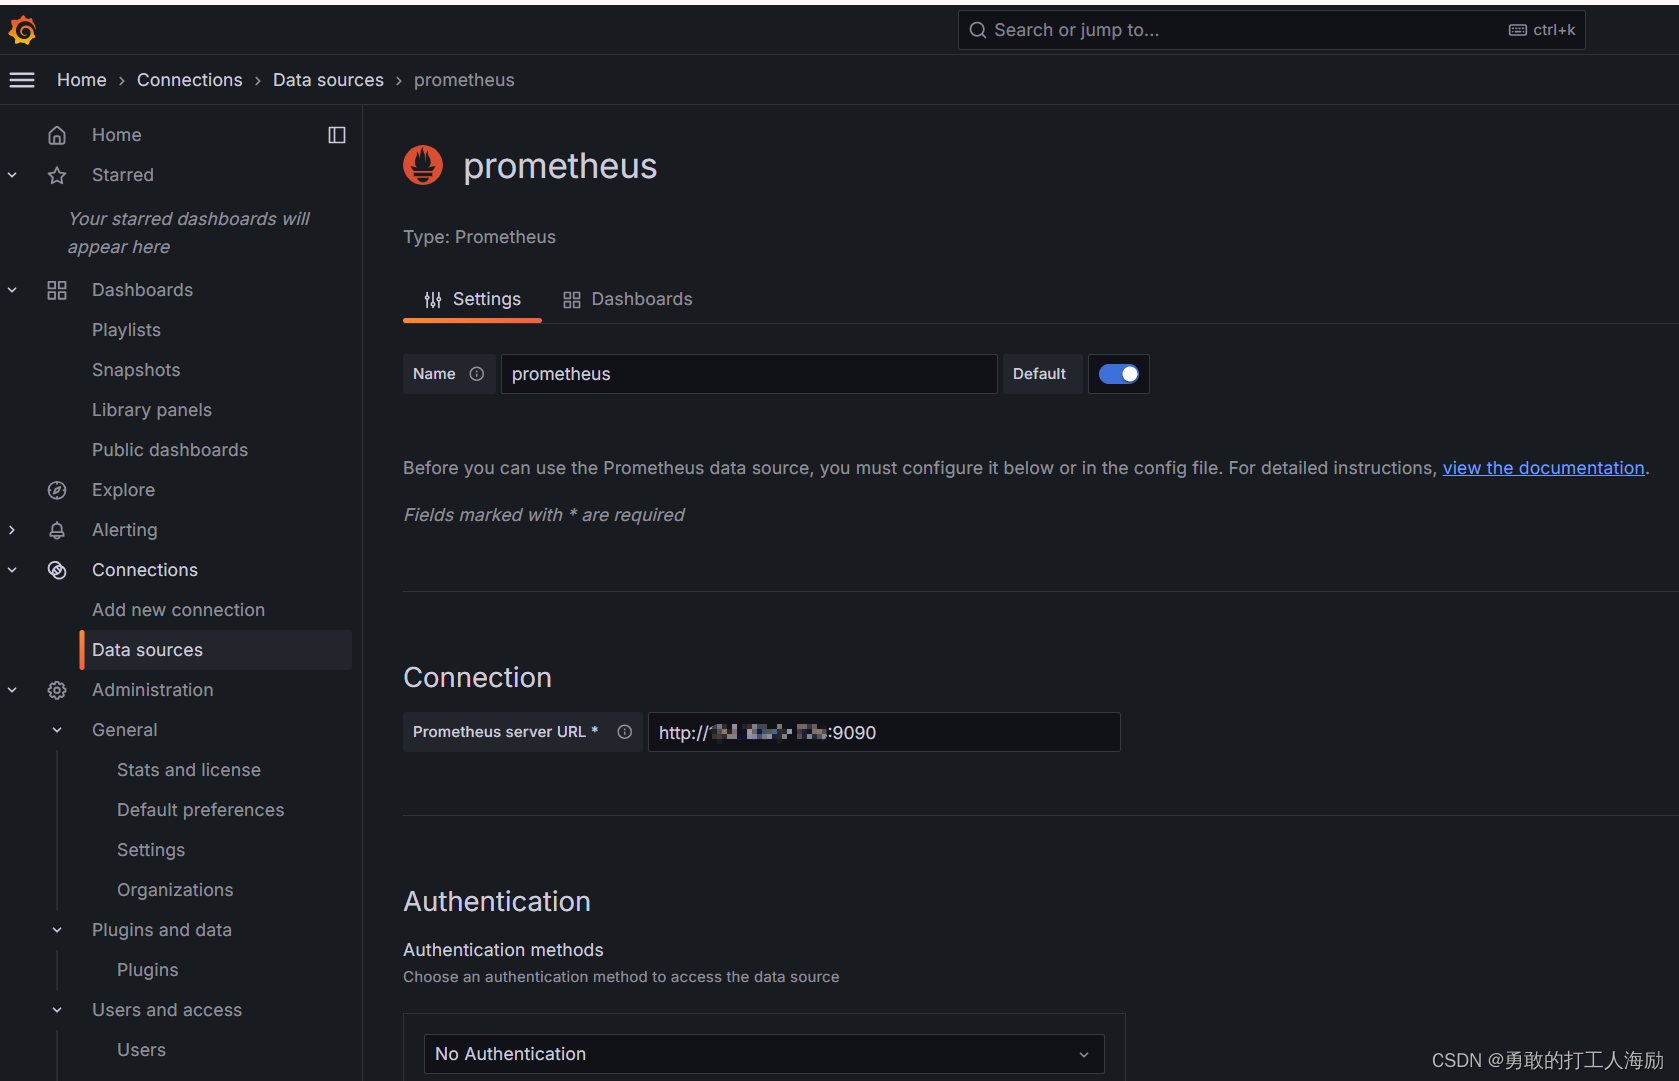
3、选择 Prometheus,填写相关信息,主要填url
4、回到首页
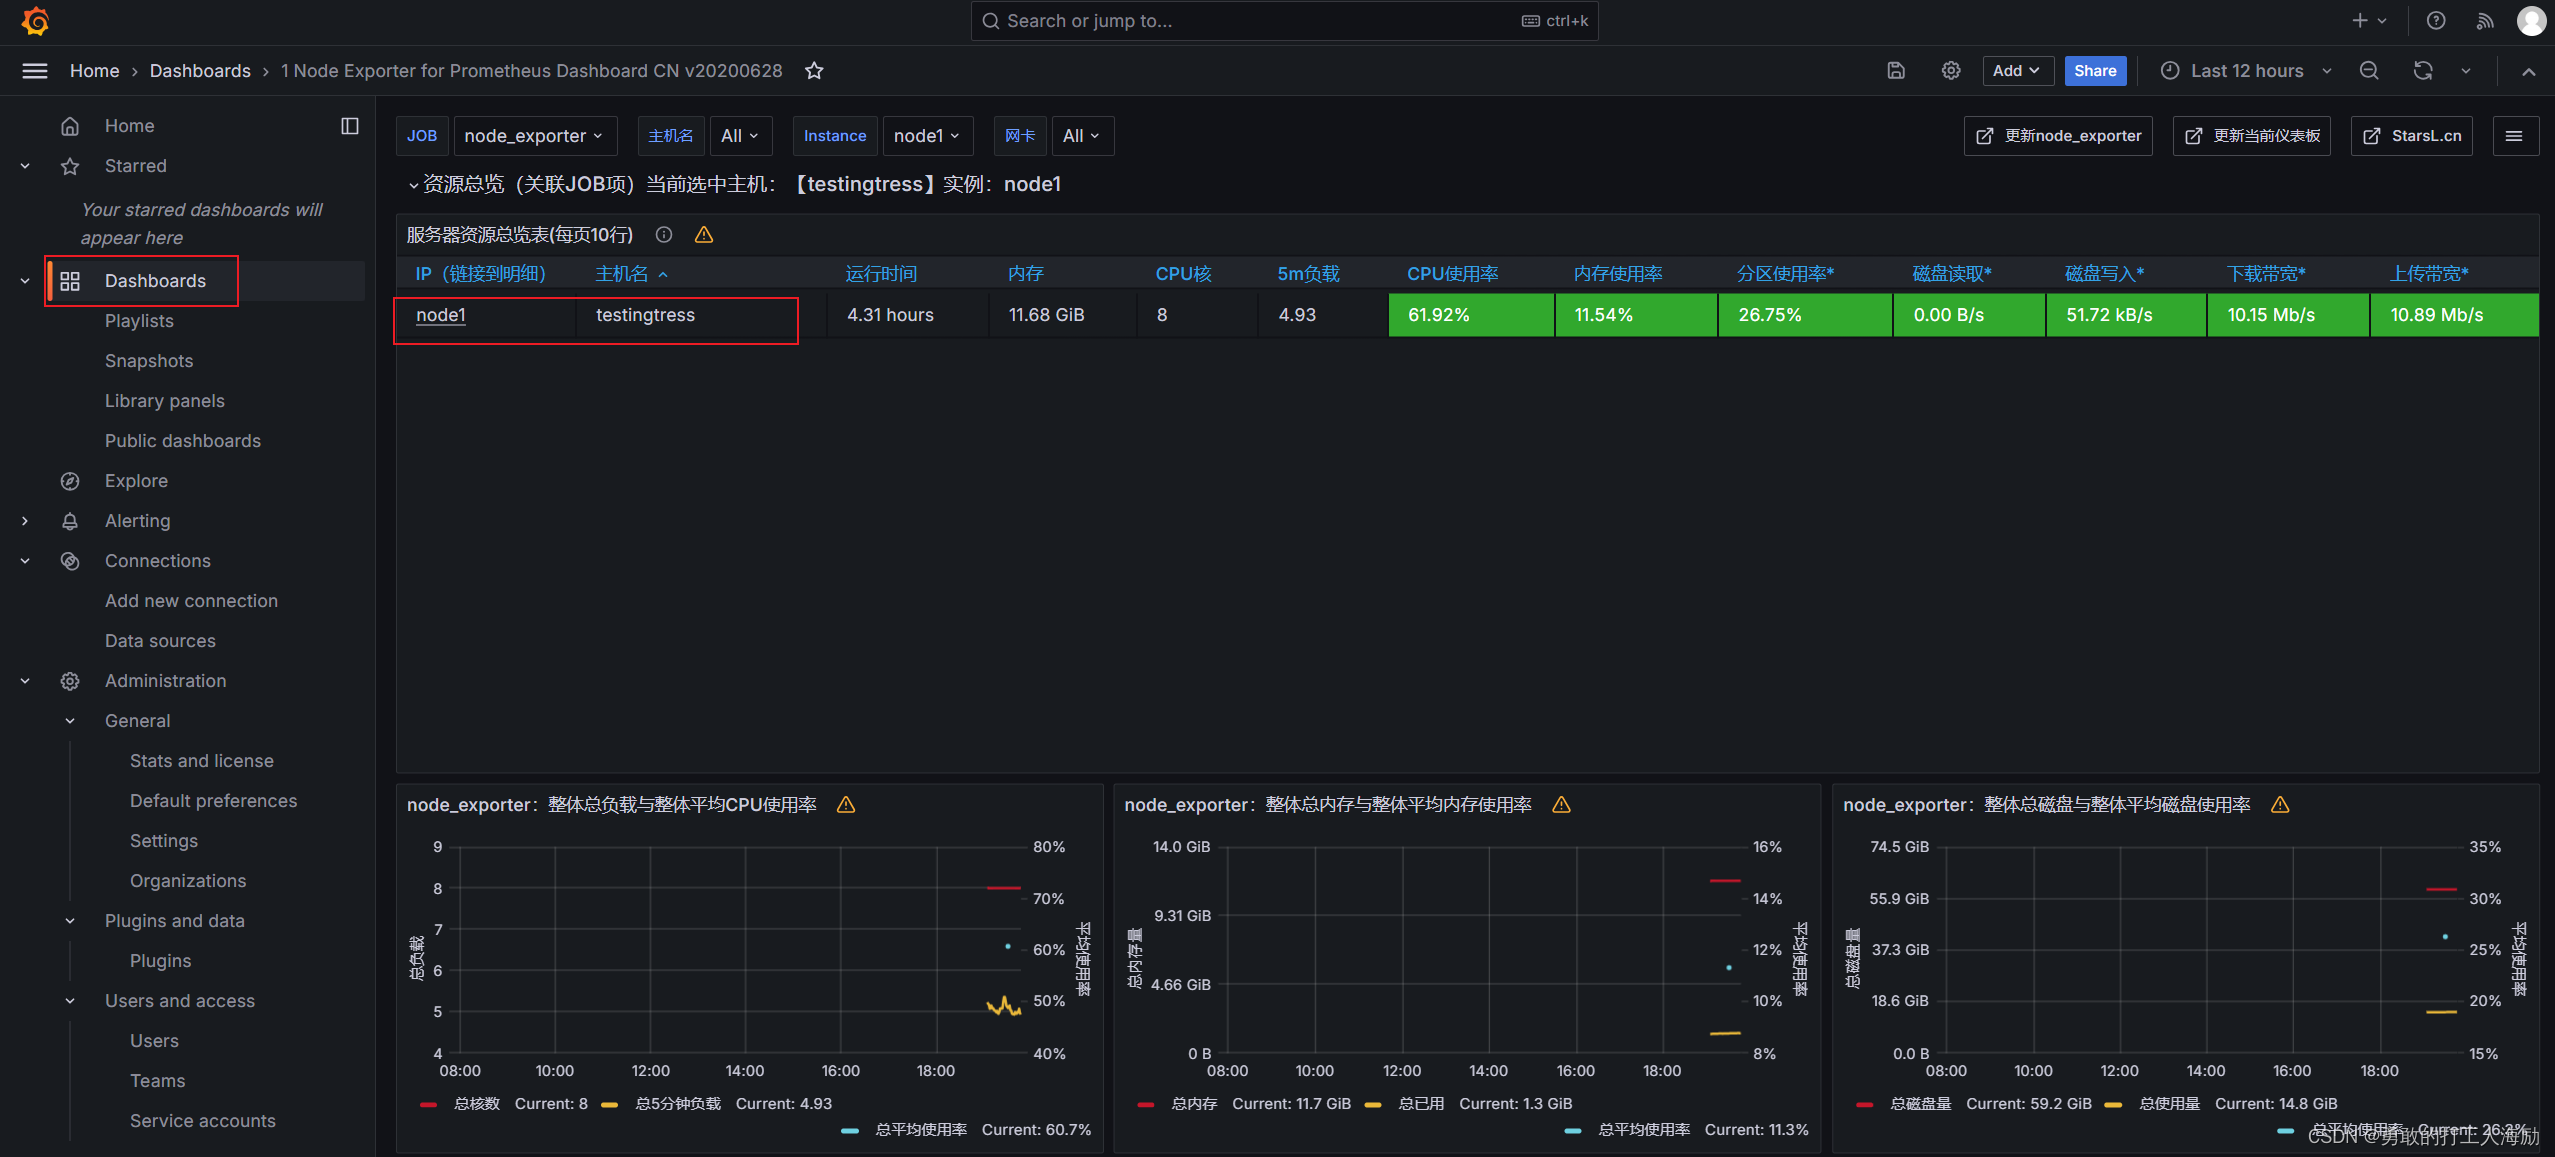
5、再点击 import
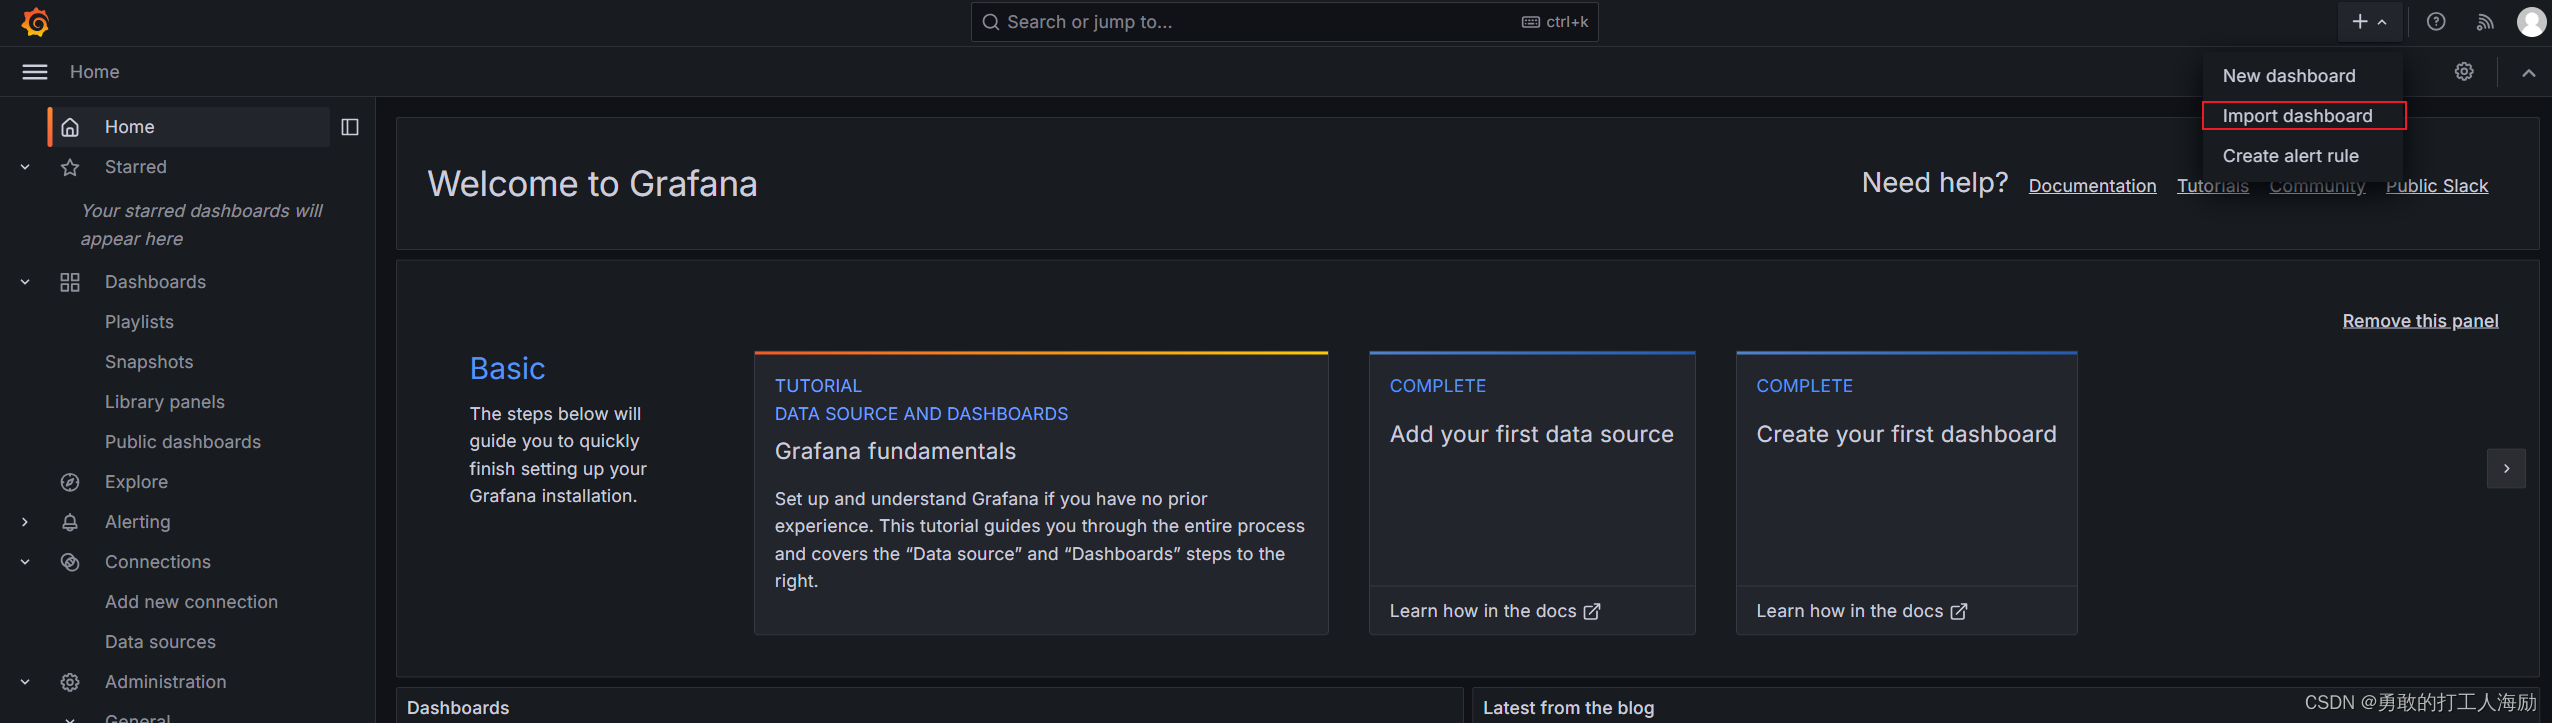
6、输入12884,点击 load
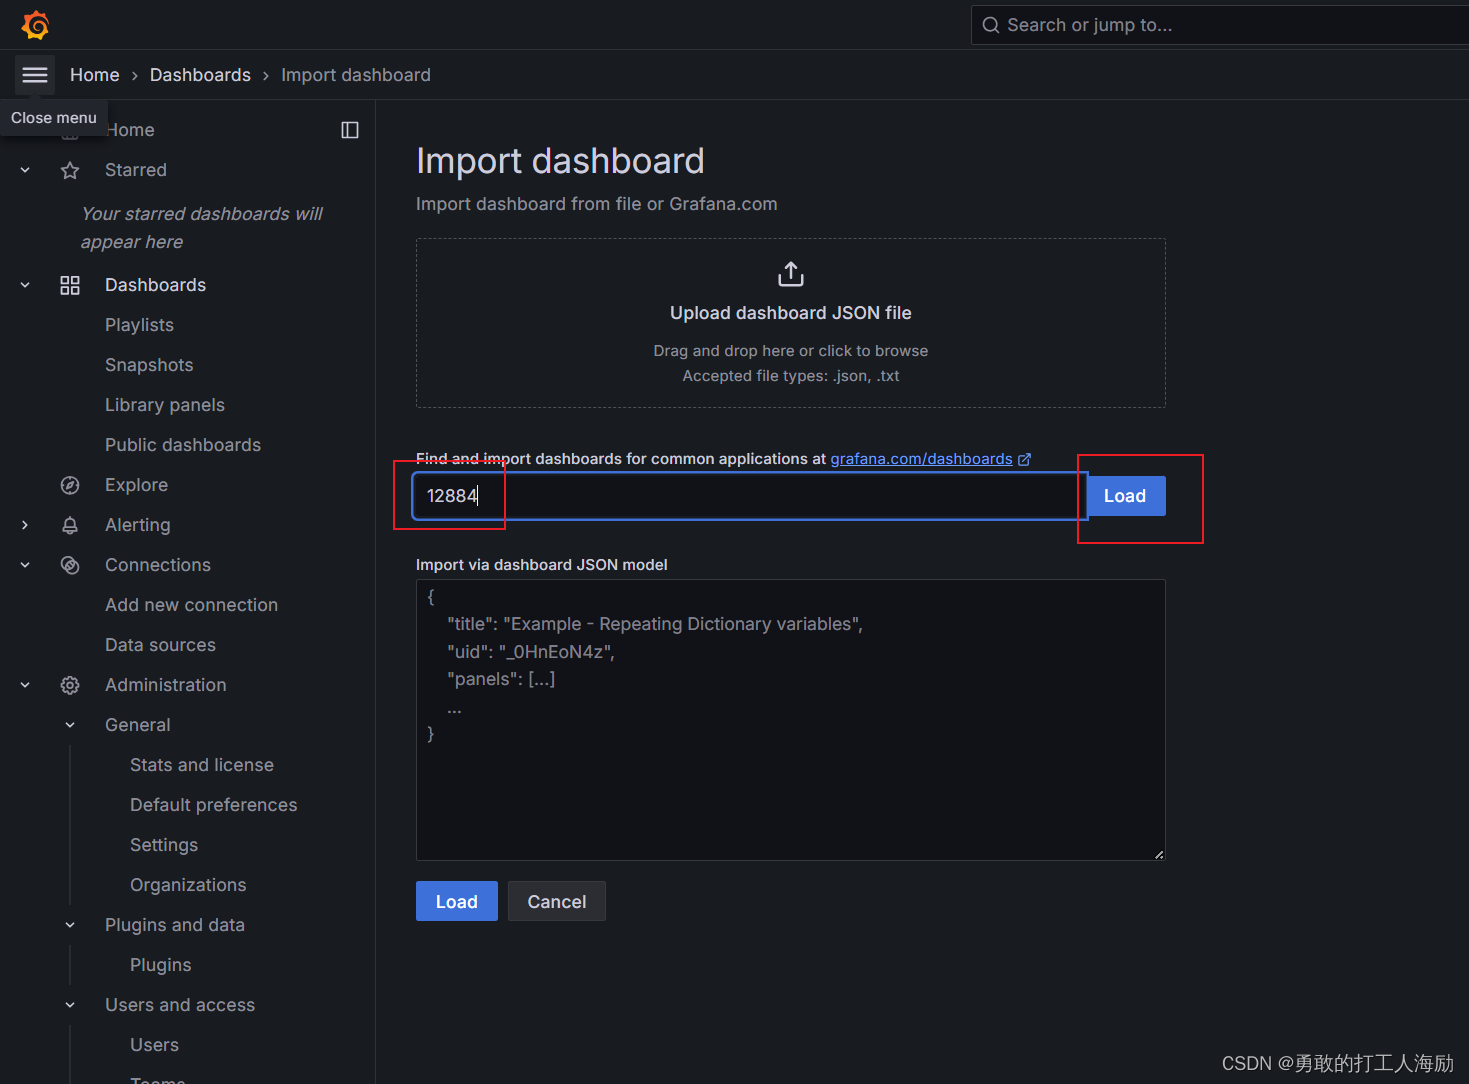
7、再点import就完成了


 3万+
3万+

 被折叠的 条评论
为什么被折叠?
被折叠的 条评论
为什么被折叠?
 到【灌水乐园】发言


