


 该文介绍了使用ESRI的10米分辨率年度土地利用/土地覆盖数据集,结合数十亿像素的深度学习模型进行影像分类。主要类别包括水体、树木、农田等。GEE代码展示了如何在GoogleEarthEngine平台上处理和可视化这些数据,同时提供了相应的颜色代码和图例。文章还引用了基于Sentinel-2和深度学习的全球土地覆盖研究。
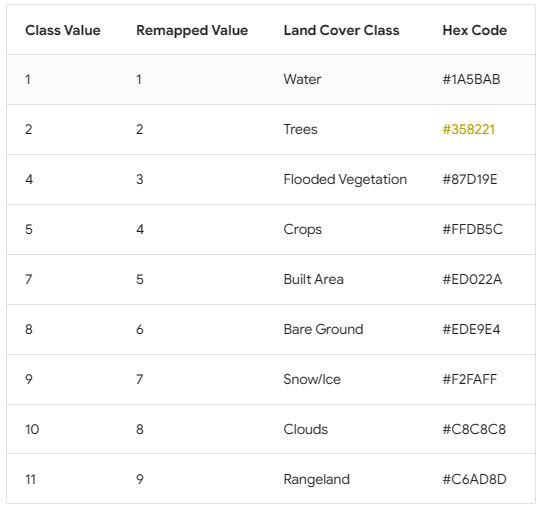
ESRI 10m Annual Land Use Land Cover (2017-2021)数据集使用数十亿个人类标记的像素来建立深度学习模型进行影像的土地分类。
主要类别:
GEE代码:
var esri_lulc10 = ee.ImageCollection("projects/sat-io/open-datasets/landcover/ESRI_Global-LULC_10m_TS");
// Define a dictionary which will be used to make legend and visualize image on map
var dict = {
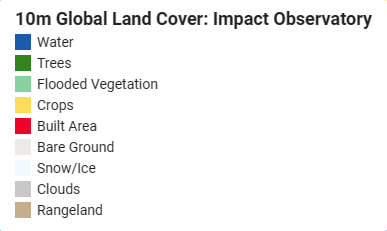
"names": [
"Water",
"Trees",
"Flooded Vegetation",
"Crops",
"Built Area",
"Bare Ground",
"Snow/Ice",
"Clouds",
"Rangeland"
],
"colors": [
"#1A5BAB",
"#358221",
"#87D19E",
"#FFDB5C",
"#ED022A",
"#EDE9E4",
"#F2FAFF",
"#C8C8C8",
"#C6AD8D"
]};
function remapper(image){
var remapped = image.remap([1,2,4,5,7,8,9,10,11],[1,2,3,4,5,6,7,8,9])
return remapped
}
// This is palette has '#000000' for value 3 and 6.
var palette = [
"#1A5BAB",
"#358221",
"#000000",
"#87D19E",
"#FFDB5C",
"#000000",
"#ED022A",
"#EDE9E4",
"#F2FAFF",
"#C8C8C8",
"#C6AD8D",
];
// Create a panel to hold the legend widget
var legend = ui.Panel({
style: {
position: 'bottom-left',
padding: '8px 15px'
}
});
// Function to generate the legend
function addCategoricalLegend(panel, dict, title) {
// Create and add the legend title.
var legendTitle = ui.Label({
value: title,
style: {
fontWeight: 'bold',
fontSize: '18px',
margin: '0 0 4px 0',
padding: '0'
}
});
panel.add(legendTitle);
var loading = ui.Label('Loading legend...', {margin: '2px 0 4px 0'});
panel.add(loading);
// Creates and styles 1 row of the legend.
var makeRow = function(color, name) {
// Create the label that is actually the colored box.
var colorBox = ui.Label({
style: {
backgroundColor: color,
// Use padding to give the box height and width.
padding: '8px',
margin: '0 0 4px 0'
}
});
// Create the label filled with the description text.
var description = ui.Label({
value: name,
style: {margin: '0 0 4px 6px'}
});
return ui.Panel({
widgets: [colorBox, description],
layout: ui.Panel.Layout.Flow('horizontal')
});
};
// Get the list of palette colors and class names from the image.
var palette = dict['colors'];
var names = dict['names'];
loading.style().set('shown', false);
for (var i = 0; i < names.length; i++) {
panel.add(makeRow(palette[i], names[i]));
}
Map.add(panel);
}
/*
// Display map and legend ///
*/
// Add the legend to the map
addCategoricalLegend(legend, dict, '10m Global Land Cover: Impact Observatory');
// Add image to the map
Map.addLayer(ee.ImageCollection(esri_lulc10.filterDate('2017-01-01','2017-12-31').mosaic()).map(remapper), {min:1, max:9, palette:dict['colors']}, '2017 LULC 10m')
Map.addLayer(ee.ImageCollection(esri_lulc10.filterDate('2018-01-01','2018-12-31').mosaic()).map(remapper), {min:1, max:9, palette:dict['colors']}, '2018 LULC 10m')
Map.addLayer(ee.ImageCollection(esri_lulc10.filterDate('2019-01-01','2019-12-31').mosaic()).map(remapper), {min:1, max:9, palette:dict['colors']}, '2019 LULC 10m')
Map.addLayer(ee.ImageCollection(esri_lulc10.filterDate('2020-01-01','2020-12-31').mosaic()).map(remapper), {min:1, max:9, palette:dict['colors']}, '2020 LULC 10m')
Map.addLayer(ee.ImageCollection(esri_lulc10.filterDate('2021-01-01','2021-12-31').mosaic()).map(remapper), {min:1, max:9, palette:dict['colors']}, '2021 LULC 10m')
代码参考:ESRI 10m Annual Land Use Land Cover (2017-2021) - awesome-gee-community-catalog
数据来源:哨兵-2 10m土地利用/土地覆被时间序列 - 概述 (arcgis.com)
在线地图(2017-2022):无标题地图 (arcgis.com)
引用:Karra, Kontgis, et al. “Global land use/land cover with Sentinel-2 and deep learning.”
IGARSS 2021-2021 IEEE International Geoscience and Remote Sensing Symposium. IEEE, 2021.


 313
313

 被折叠的 条评论
为什么被折叠?
被折叠的 条评论
为什么被折叠?
 到【灌水乐园】发言


