


文章目录
结果效果展示
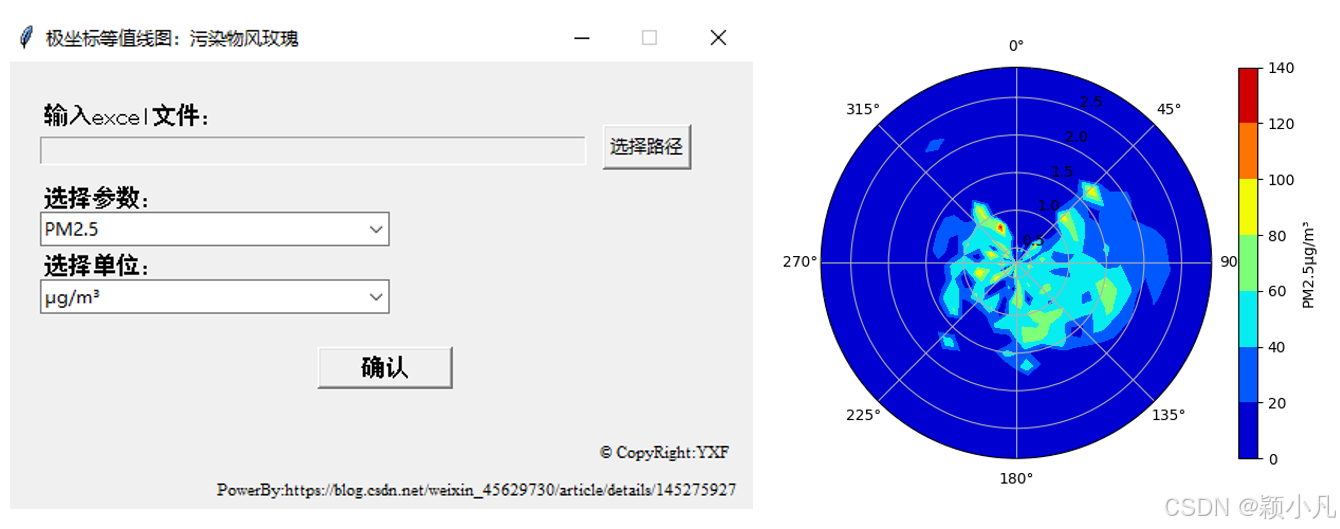
案例结果:一个exe。
实现功能:用户输入本地excel文件(风速、风向、污染物浓度),选择污染物参数,绘制该污染物在“风速-风向”极坐标下的等值图。
写在最前面的Power By
1、基础语法:https://www.runoob.com/python/python-gui-tkinter.html
2、图形界面基础代码框架:https://blog.youkuaiyun.com/m0_61139217/article/details/122690016
3、可读取文件绝对路径格式:https://blog.youkuaiyun.com/qq_44239466/article/details/90250938
4、界面控件多种样例:https://blog.youkuaiyun.com/ever_peng/article/details/107207176
5、极坐标等值线代码框架:https://blog.youkuaiyun.com/qq_35189715/article/details/105034187
6、打包为exe:https://blog.youkuaiyun.com/libaineu2004/article/details/112612421
PS:感谢互联网上一众慷慨解囊的大大,感恩的心
一、准备工作
1.1 库包准备
#GUI
pip install Tkinter
#数据分析
pip install numpy
pip install pandas
#数据可视化
pip install matplotlib
#打包为exe
pip install Pyinstaller
1.2数据准备
具备风速(WS)、风向(WD)、污染物浓度的Excel文件(编写时,保证表头与参数一致即可)。
| datatime | WS | WD | PM2.5 | PM10 | SO2 | NO2 | O3 | CO |
|---|---|---|---|---|---|---|---|---|
| 2024-11-24 0:00:00 | 0.7 | 101.7 | 36 | 51 | 6 | 14 | 28 | 0.7 |
| 2024-11-24 1:00:00 | 1.1 | 62.3 | 35 | 49 | 5 | 15 | 26 | 0.7 |
| 2024-11-24 2:00:00 | 0.9 | 93.2 | 36 | 51 | 5 | 15 | 31 | 0.7 |
| … | … | … | … | … | … | … | … |
二、编写代码
2.1 import
import tkinter
from tkinter import filedialog
from tkinter import ttk
import numpy as np
import pandas as pd
import matplotlib.pyplot as plt
2.2创建图形界面
实现功能:创建一个根界面。
root = tkinter.Tk()
root.title('极坐标等值线图:污染物风玫瑰')
max_w, max_h = root.maxsize()
root.geometry(f'500x300+{int((max_w - 500) / 2)}+{int((max_h - 300) / 2)}')  # 居中显示
root.resizable(width=False, height=False)
2.3用户输入本地excel
实现功能:图形控件,并在用户点击【选择路径】按钮后,弹出本地文件窗口;用户选择文件后,在图形界面上显示输入文件的绝对路径文本。
# 输入框组件
## 标题
label3 = tkinter.Label(root, text='输入excel文件:', font=('黑体', 12))
label3.place(x=25, y=25)
## 组件
entry_text = tkinter.StringVar()
entry = tkinter.Entry(root, textvariable=entry_text, font=('Times New Roman', 10), width=60, state='readonly')
entry.place(x=25, y=50)

# 定义【获取本地文件绝对路径】的函数
def get_path():
    # 返回本地文件路径
    path = filedialog.askopenfilename(title='请选择文件')
    # 保证路径格式程序可读取
    path = path.replace("/", "\\\\")
    # 获取路径文本
    entry_text.set(path)

# 执行get_path()函数按钮
button1 = tkinter.Button(root, text='选择路径', command=get_path)
button1.place(x=400, y=42)
2.4用户输入污染物参数及单位
实现功能:在根界面上设置下拉菜单,供用户输入参数与单位。
#1、污染物参数下拉菜单
## 文本
label4 = tkinter.Label(root, text='选择参数:', font=('黑体', 12))
label4.place(x=25, y=80)
## 组件
xVariable1 = tkinter.StringVar()
com1 = ttk.Combobox(root, textvariable=xVariable1,width=30)
com1["value"] = ("PM2.5", "PM10", "O3","CO","SO2","NO2")
com1.current(0)
com1.place(x=25, y=100)

#2、单位下拉菜单
## 文本
label5 = tkinter.Label(root, text='选择单位:', font=('黑体', 12))
label5.place(x=25, y=125)
## 组件
xVariable2 = tkinter.StringVar()
com2 = ttk.Combobox(root, textvariable=xVariable2,width=30)
com2["value"] = ("μg/m³", "mg/m³")
com2.current(0)
com2.place(x=25, y=145)
2.5读取用户输入内容并输出结果图件(核心)
实现功能:点击【确定】按钮后,以get()方法,读取用户输入的excel绝对路径、污染物参数、单位,执行“绘制极坐标等值图”函数。
#定义【确认】按钮执行的函数
def get_user_input():
    #通过get()方法获取用户输入的值
    file_path =entry_text.get() #excel文件
    value=xVariable1.get() #污染物参数
    unity=xVariable2.get() #单位

    #绘图核心代码块
    ## 读取excel
    data = pd.read_excel(file_path)
    ## 度转为弧度
    data['WD'] = np.radians(data['WD'])

    v = data['WS']
    d = data['WD']
    ## 风速按16等分分类
    speed = np.linspace(v.min(), v.max(), endpoint=True, num=16)
    ## 全风向按32等分分类(2Π)
    deg = np.linspace(0, 2 * np.pi, endpoint=True, num=32)

    ## 将划分网格内的数据按较小值划分
    def maker(s, sequence):
        for i, val in enumerate(sequence[:-1]):
            if s <= sequence[i + 1]:
                return val
    data['WS'] = v.apply(maker, sequence=speed)
    data['WD'] = d.apply(maker, sequence=deg)

    ## 污染物参数转为float类型
    data[value] = data[value].astype(float)
    dt = data.pivot_table(values=value, index='WS', columns='WD', aggfunc=np.mean)

    ## 缺失的网格用0值填充
    dt.fillna(0, inplace=True)
    dt = dt.reindex(index=speed, columns=deg, fill_value=0)

    ## 绘制风玫瑰图
    theta, r = np.meshgrid(deg, speed)
    ax = plt.subplot(projection='polar')
    ax.set_theta_zero_location("N")
    ax.set_theta_direction('clockwise')
    pos = ax.contourf(theta, r, dt.to_numpy(), cmap='jet')

    ## 添加色条并设置标签(显示污染物参数+单位)
    cbar = plt.colorbar(pos, ax=ax)
    cbar.set_label(value+"("+unity+")")
    ## 展示
    plt.show()

#确认按钮
button2 = tkinter.Button(root, text='确认',font=('黑体', 12),width=10, command=get_user_input)
button2.place(x=210, y=190)
2.6主事件循环
root.mainloop()
2.7完整代码
import tkinter
from tkinter import filedialog
from tkinter import ttk
import numpy as np
import pandas as pd
import matplotlib.pyplot as plt

#创建界面
root = tkinter.Tk()
root.title('极坐标等值线图:污染物风玫瑰')
max_w, max_h = root.maxsize()
root.geometry(f'500x300+{int((max_w - 500) / 2)}+{int((max_h - 300) / 2)}')  # 居中显示
root.resizable(width=False, height=False)

# CopyRight、PowerBy
label1 = tkinter.Label(root, text='© CopyRight:YXF', font=('Times New Roman', 8))
label1.place(x=395, y=250)
label2 = tkinter.Label(root, text='PowerBy:https://blog.youkuaiyun.com/weixin_45629730/article/details/145275927', font=('Times New Roman', 8))
label2.place(x=140, y=275)

# 显示文件路径文本框
label3 = tkinter.Label(root, text='输入excel文件:', font=('黑体', 12))
label3.place(x=25, y=25)
entry_text = tkinter.StringVar()
entry = tkinter.Entry(root, textvariable=entry_text, font=('Times New Roman', 10), width=60, state='readonly')
entry.place(x=25, y=50)

# 定义获取文件路径文本的函数
def get_path():
    path = filedialog.askopenfilename(title='请选择文件')
    path = path.replace("/", "\\\\")
    entry_text.set(path)

# 选择路径按钮
button1 = tkinter.Button(root, text='选择路径', command=get_path)
button1.place(x=400, y=42)

#污染物参数下拉菜单
label4 = tkinter.Label(root, text='选择参数:', font=('黑体', 12))
label4.place(x=25, y=80)
xVariable1 = tkinter.StringVar()
com1 = ttk.Combobox(root, textvariable=xVariable1,width=30)
com1["value"] = ("PM2.5", "PM10", "O3","CO","SO2","NO2")
com1.current(0)
com1.place(x=25, y=100)

#单位下拉菜单
label5 = tkinter.Label(root, text='选择单位:', font=('黑体', 12))
label5.place(x=25, y=125)
xVariable2 = tkinter.StringVar()
com2 = ttk.Combobox(root, textvariable=xVariable2,width=30)
com2["value"] = ("μg/m³", "mg/m³")
com2.current(0)
com2.place(x=25, y=145)

#定义绘制风玫瑰图函数
def get_user_input():
    file_path =entry_text.get()
    value=xVariable1.get()
    unity=xVariable2.get()

    data = pd.read_excel(file_path)
    # 风向转换为弧度
    data['WD'] = np.radians(data['WD'])
    #定义坐标轴
    v = data['WS']
    d = data['WD']
    speed = np.linspace(v.min(), v.max(), endpoint=True, num=16)
    deg = np.linspace(0, 2 * np.pi, endpoint=True, num=32)
    def maker(s, sequence):
        for i, val in enumerate(sequence[:-1]):
            if s <= sequence[i + 1]:
                return val
    data['WS'] = v.apply(maker, sequence=speed)
    data['WD'] = d.apply(maker, sequence=deg)

    #在定义的坐标轴下,定义绘制的参数
    data[value] = data[value].astype(float)
    dt = data.pivot_table(values=value, index='WS', columns='WD', aggfunc=np.mean)
    dt.fillna(0, inplace=True)
    dt = dt.reindex(index=speed, columns=deg, fill_value=0)

    # 绘制风玫瑰图
    theta, r = np.meshgrid(deg, speed)
    ax = plt.subplot(projection='polar')
    ax.set_theta_zero_location("N")
    ax.set_theta_direction('clockwise')
    pos = ax.contourf(theta, r, dt.to_numpy(), cmap='jet')

    # 添加色条并设置标签
    cbar = plt.colorbar(pos, ax=ax)
    cbar.set_label(value+"("+unity+")")
    plt.show()
#确认按钮
button2 = tkinter.Button(root, text='确认',font=('黑体', 12),width=10, command=get_user_input)
button2.place(x=210, y=190)

root.mainloop()
三、打包为exe
请参考写在最前面的PowerBy,本文不再赘述。


 7799
7799

 被折叠的 条评论
为什么被折叠?
被折叠的 条评论
为什么被折叠?
 到【灌水乐园】发言


