


Calculation of Ground Water Ages—A Comparative Analysis
Abstract
Groundwater age is a fundamental, yet complex, concept in groundwater hydrology. Discrepancies between results obtained through different modeling approaches for groundwater age calculation have been reported, in particular, between groundwater ages modeled by advection and direct simulation of groundwater ages (e.g., age-mass approach), which includes effects of advection and dispersion. Here, through a series of two-dimensional (2D) simulations, the impact of water mixing through advection and dispersion on modeled 14C and directly simulated groundwater ages is assessed. The impact of dispersion on modeled ages is systematically stronger in areas where water velocities are smaller and far more pronounced on 14C ages. This effect is also observed in one-dimensional models. 2D simulations show that longitudinal dispersion generally acts as a ‘‘source’’ of 14C, while vertical dispersion acts as a ‘‘sink,’’ leading to apparent younger or older modeled 14C ages as compared to advective and directly simulated groundwater ages. The presence of permeable and impermeable faults provides an equally important source for discrepancies, leading to major differences in modeled ages among the three methods considered. Overall, our results show that a 14C modeling approach using a solute transport model for calculating groundwater age appears to be more reliable in groundwater systems without faults and where water velocities are relatively high than in systems that are relatively more heterogeneous and those where faults are present. Among the three modeling approaches considered here, direct simulation of groundwater age seems to yield the most consistent results in complex, heterogeneous groundwater flow systems, giving a vertical age structure consistent with ages expected from consideration of the flow system.
Introduction
The concept of ‘‘groundwater age’’ is one of the most fundamental in groundwater hydrology. Fundamental because it is critical to the effective management of groundwater resources, prediction of the rate at which a contaminant migrates, or, yet, reconstruction of the past climate through the use of noble gases dissolved in groundwater. Knowing the age of groundwater implies knowing precisely how a particular groundwater system functions, i.e., its hydrodynamic parameters (e.g., hydraulic head distribution, hydraulic conductivity field, and porosity), recharge rates, and cross-formational rates of flow and mass within the system of interest.
Traditionally, two approaches have been used to estimate the age of groundwater: estimation of groundwater ages through application of the piston flow model concept and through the use of radioisotope tracers (e.g., 3H, 14C, 36Cl; see Phillips and Castro, 2003). The first approach considers the age of groundwater as corresponding simply to the time elapsed along a streamline since recharge took place. The basic assumption is the presence of a closed system and the absence of water mixing of different ages both across formations and within the aquifer itself. The second method, as traditionally employed assuming that all necessary geochemical corrections have been applied (e.g., Plummer et al., 1991), is used under the assumption that radioactive decay is the dominant process causing a reduction/change in the tracer concentration. Although concentrations of these tracers are also affected by groundwater mixing through advection, dispersion, and/or diffusion, the impact of such processes on the tracer’s concentration is often neglected and is not taken into account in the age calculation (e.g., Stute et al., 1992; Castro et al., 2000). Thus, when such processes are not considered, radioisotope ages will correspond to the ‘‘true’’ water ages only in the presence of a closed system and total absence of water mixing. This is, however, not the case for most groundwater systems (Pint et al., 2003). Movement of water in porous media is, in addition to advection and like any other tracer, also affected by kinematic dispersion, molecular diffusion, and cross-formational flow, which leads to mixing of water molecules with different ages. Independent of the chosen approach, more accurate groundwater ages should be obtained by considering transport by advection, dispersion, and diffusion.
The concept of groundwater age has been recently reexamined by hydrogeologists in order to derive model ages that can be compared to field measurements (Goode, 1996; Varni and Carrera, 1998; Bethke and Johnson, 2002a, 2002b). In this approach, a parallel is made between water age and solute concentration. Groundwater age is directly simulated by taking into account not only advection but also dispersion and diffusion, and the quantity conserved is the product of water age and its mass. Thus, if groundwater mixing processes are non-negligible, direct simulation of groundwater age (e.g., age-mass approach), which incorporates mixing of water molecules in the age calculation, should provide more realistic ages than the more traditional methods in which mixing is typically neglected. This is expected to be particularly true in complex groundwater systems.
With respect to 14C, which is the tracer of choice for late Pleistocene and Holocene paleoclimatic reconstructions through the use of noble gases dissolved in groundwater (e.g., Stute et al., 1992; Weyhenmeyer et al., 2000), issues dealing with the loss of 14C by diffusion toward neighboring aquitards leading to apparent older 14C ages have been addressed (e.g., Sudicky and Frind, 1981; Walker and Cook, 1991; Sanford and Buapeng, 1996; Sanford, 1997). On the contrary, with the exception of a theoretical analysis on the impact of longitudinal dispersion (Johnson and DePaolo, 1996), the influence of mixing of water of different ages through advection alone and that of longitudinal and transverse dispersion, in particular, on 14C ages has received more limited attention.
Here, through a series of two-dimensional (2D) simulations carried out for a complex real groundwater flow system, the impact of water mixing through advection as well as that of dispersion is assessed by comparing groundwater ages calculated using an advective model, ages based on 14C simulated using a solute transport model, and directly simulated ages. It will be shown how these different modeling approaches respond to changes in hydraulic conductivity and the presence of permeable and impermeable faults in the system. The combined influence of horizontal and vertical dispersion on modeled ages and the resulting vertical and horizontal age distribution are discussed. Through a one-dimensional (1D) analysis, the impact of horizontal dispersion on 14C ages as well as its dependency on groundwater velocities is illustrated.
For comparative purposes, our starting point will be a 2D groundwater flow model of flow in the Carrizo Aquifer and surrounding formations in southwest Texas that has been calibrated with 4He and 3He concentrations (Castro and Goblet, 2003a; Castro, 2004) and for which advective and directly simulated groundwater ages (Castro and Goblet, 2003a, 2003b) have been calculated. In this system, based on C isotope measurements available in a number of water samples, 14C ages were previously estimated following the traditional approach in which mixing processes are not considered (Castro et al., 2000). Only radioactive decay and chemical interactions were taken into account in this 14C age calculation, and no attempt to simulate 14C transport in the system with incorporation of mixing processes was made. Subsequent comparison of these calculated 14C ages with modeled advective ages (Castro and Goblet, 2003a) and those obtained through direct simulation of groundwater age (Castro and Goblet, 2003b) shows lack of agreement at several locations. Here, we attempt to shed some light on possible physical processes that can lead to such discrepancies when different model approaches are considered for the age calculation.
Regional and Hydrogeological Setting
The Eocene Carrizo Aquifer is a major groundwater flow system exposed on the northwestern margin of the Gulf Coast Basin in South Texas (Figure 1a). In Atascosa, McMullen, and portions of surrounding counties (Figure 1b), the Carrizo Aquifer lies unconformably on the Lower-Wilcox Formation, a confining layer composed of mudstones and clay (Figure 1c; Hamlin, 1988). The confining Recklaw Formation conformably overlies the Carrizo Aquifer and is in turn overlain by the Queen City Aquifer. These formations crop out subparallel to the present-day coastline and dip to the southeast (Figures 1b and 1c). The Carrizo Aquifer terminates at a major growth-fault system, the Wilcox Geothermal Corridor (Figures 1a and 1b). The presence of minor faults is also known in these formations.
Carrizo and Recklaw hydraulic conductivities decrease exponentially over 4 orders of magnitude with increased distance from the recharge area and depth, a decrease that reflects the combined influences of differential compaction of the media as well as down-dip lithological change (Patriarche et al., 2004), giving origin to a complex velocity field (Figure 1c). Calibrated hydraulic conductivities in the recharge area for the Carrizo and Recklaw are 5 × 10⁻⁴ and 3 × 10⁻⁸ m/s, respectively (Castro and Goblet, 2003a). Calibration was obtained by applying exponentially decreasing factors Fc = exp⁻²((xc − 6633)/12,000) and Fr = exp⁻²((xr − 19,133)/12,000) to the Carrizo and Recklaw, respectively, where xc and xr represent any point at a distance x from the origin of the Carrizo and Recklaw outcrop areas, respectively.
Hydraulic conductivity values for the Carrizo and Recklaw in the discharge area are 3 × 10⁻⁸ and 6.4 × 10⁻¹² m/s, respectively. For the Queen City and Lower-Wilcox formations, we have adopted uniform hydraulic conductivities of 5 × 10⁻⁵ and 1 × 10⁻¹¹ m/s, respectively. Average porosity values used in the simulations presented here are 20%, 12.5%, 35%, and 26% for the Queen City, Recklaw, Carrizo, and Wilcox formations, respectively (Castro and Goblet, 2003a). Water infiltrates in the Carrizo outcrop area and flows toward the southeast. Discharge occurs by cross-formational upward leakage through the Recklaw. Groundwater flow simulations (Castro and Goblet, 2003a) clearly show the presence of semivertical directions of water velocities toward the Recklaw Formation at the top of the Carrizo Aquifer, illustrating the effectiveness of indirect recharge for this confining layer. Near the outcrop, water movement in the Queen City is semivertical due to the strong upward leakage into the Recklaw. Elsewhere, the direct influence of upward leakage in the Queen City is not detected, and flow in this aquifer becomes essentially horizontal in response to the rapid decrease in hydraulic conductivities of the Recklaw.
Calculation of Ground Water Ages
All steady-state groundwater flow simulations presented here were conducted as described by Castro and Goblet (2003a) along cross section AA9 (Figure 1c). The finite-element model is represented by a triangular mesh corresponding to a 120.6-km-long stratigraphic cross section between 220 and 22,210 m of elevation, and it comprises 58,968 elements and 31,949 nodes. The mesh is composed of triangles uniformly distributed over the entire length of the cross section with a maximum element length of 50 m. The mesh size was chosen to meet three objectives: (1) proper discretization of the different formations and, particularly, of the Carrizo Aquifer; (2) the possibility to introduce sufficiently small values of dispersivity (Table 1); and (3) the ability to extend the 2D mesh into a three-dimensional one (Patriarche et al., 2004). For most of the calculations, the element size conforms to the classical stability criterion for the numerical approximation of the advection-dispersion equation such that longitudinal dispersivity is more than twice the element size. Sensitivity tests with much smaller dispersivity values (aL = 12.5 m, aT = 1.25 m) yield results that are not significantly different from the results presented here. In addition, sensitivity tests conducted using a much finer mesh (2.5 m) show that no important bias was introduced by not strictly conforming to the criterion. It is important to note, however, that in the following discussion, emphasis is not on absolute ages; rather, it is on differences in behavior displayed by three different modeling approaches under the same geological and hydrogeological conditions and physical parameters.
Boundary conditions for the 2D groundwater flow model include hydraulic head values prescribed on the outcrop areas of all formations, as well as on top of the Queen City Aquifer. At the base of the Wilcox, a no-flow boundary condition was imposed. In addition, a high hydraulic conductivity value of 10⁻²⁵ m/s was imposed at the top of the Queen City in the Wilcox Geothermal Corridor area, allowing water to be evacuated upward, representing the situation occurring at the major growth-fault system.
Subsequently, we describe the procedure used for age calculations with the three different modeling approaches: (1) application of the piston flow model principle referred to here as "advective ages"; (2) direct simulation of groundwater ages; and (3) simulation of 14C transport and corresponding modeled ages, referred to here as "14C ages."
Advective Ages
For all groundwater flow simulations, advective ages were calculated, taking into account the established hydraulic gradients, hydraulic conductivity values, porosities, and Darcy velocities. Water travel times were calculated along streamlines as follows:
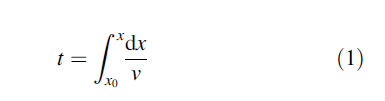
where x₀ represents the origin of a particular streamline; x, a point at any distance x from the origin of the streamline; and v, the modeled pore water velocity. Only advection is taken into account in this age estimation. Thus, mixing of groundwater, both cross-formational and within the different formations, is not considered.
Direct Simulation of Ground Water Age
For all groundwater flow simulations presented here, all groundwater age simulations were carried out in steady state and calculated as follows:
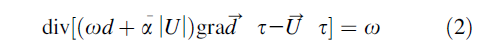
where x is the porosity, d is the tritiated water diffusion coefficient in porous media multiplied by the tortuosity coefficient (Table 1), a is the dispersivity tensor (m) expressed in the two main directions of anisotropy by aL and aT, respectively, in the longitudinal and the transverse directions of flow (Table 1), s is the age, and U is the Darcy velocity (m/s).
To account for groundwater mixing, we treat water age as one would treat a solute concentration; water age (in seconds) is simulated by considering the product of water mass (qV) and age (s) (Goode 1996), where q is the water density (kg/m³) and V is the water volume (m³). This quantity, referred to as ‘‘age-mass’’ (kg s), is conserved and is equivalent to moles of a solute tracer. Boundary conditions included zero–age-mass flux across all no-flow and inflow boundaries of the domain (AA’; Figures 1b and 1c) and no age-mass dispersive flux across outflow boundaries.
Directly simulated water age can be compared to the concentration of a conservative tracer that is not affected by chemical reactions and that accumulates in groundwater due to in situ production as well as an external deeper source. Helium is probably the closest example of such a tracer (Castro and Goblet 2003a).
14C Ages
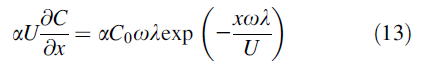
For all groundwater flow simulations presented, transport of 14C was simulated in the entire system (cross section AA’, Figure 1c) in steady state by taking into account advection, dispersion, diffusion, and radioactive decay following:
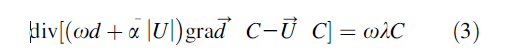
where d is the diffusion coefficient for HCO3²⁻ multiplied by the tortuosity coefficient (Table 1), and k (T⁻¹) is the radioactive decay constant for 14C of 3.84 × 10⁻¹²/s, taking into account its half-life of 5730 years (Mann et al. 1961). In a similar approach to that of Sudicky and Frind (1981), and for the sake of simplicity, concentrations of the stable carbonate species are assumed to be uniform throughout the system, with variations of 14C due only to radioactive decay and transport processes. In this situation, the 14C concentration C is expressed as percent modern carbon (pmc). Boundary conditions include a prescribed pmc of 90 (C₀) in all outcrop areas, which corresponds to the measured percent modern 14C value in the Carrizo recharge area (Castro et al. 2000). For all other external boundaries, in particular the top of the Queen City, an outlet condition was prescribed that allows 14C to exit the system by advection. At the bottom of the Wilcox, however, water is devoid of 14C content due to the very low hydraulic conductivities in place. Here, diffusion is the dominant transport mechanism, and 14C exits the Carrizo toward the Wilcox in an attempt to reach isotopic equilibrium. Migration of 14C into the Wilcox is, however, very limited in distal extent due to its relatively short half-life. In all formations, waters are also devoid of 14C at the southernmost limit of the system.
After simulation of 14C transport in the system, 14C ages were then calculated following the traditional approach in which 14C is assumed to be transported only by advection, and where dispersion, diffusion, and groundwater mixing (cross-formational and within each formation) are neglected. In this case, the water age A (T) that results from simulated 14C concentrations is given by:
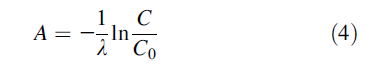
If 14C concentrations changed (were reduced) as a result of radioactive decay alone and 14C transport was only by advection in total absence of groundwater mixing, then the obtained 14C ages should correspond to the calculated advective ages in the entire system. In the examples given and analysis that follows, we will see that this is not the case. More importantly, it will be shown that, for a diversity of natural settings, 14C ages calculated following this approach do not respond to changes in the hydrogeological system in a similar manner to modeled advective ages, nor to ages obtained through direct simulation of groundwater age, which portrays the behavior of the water molecule. The most important distinction between simulated water ages and a tracer such as 14C lies in the conservative vs. nonconservative nature of these two tracers.
Although in our 14C transport simulations all mixing processes due to advection, dispersion, and diffusion were accounted for, which is what happens in a real system, it is important to note that our calculated 14C ages, following the most common approach taken for 14C groundwater dating, are unadjusted to account for both ‘‘losses’’ and/or ‘‘additions’’ of 14C that have occurred in the system due to mixing processes (e.g., dispersion). As a result, 14C ages determined using this procedure will yield, in certain cases, apparent older or younger ages than one would expect the real age of groundwater to be, further reinforcing the argument that such modeled 14C ages do not always accurately portray the dynamics of the groundwater system itself.
Simulation Results and Discussion
We proceed to illustrate how the three different modeling approaches lead to differences in calculated ages under distinct hydrogeological conditions. We also illustrate how groundwater mixing through advection and dispersion impacts differently the calculation of ages obtained through direct simulation of groundwater age and those obtained through transport of 14C. Results of simulations presented here are meant to compare how each modeling approach behaves under different scenarios in one complex aquifer system that represents the Carrizo Aquifer and surrounding formations. When employing these modeling approaches in other complex systems where fluvial, deltaic, and marine depositional environments are present, relative behavior similar to the results presented here is expected. However, these results and, in particular, the observed differences in absolute modeled age values should not be generalized and directly applied to other systems.
Impact of Horizontal Dispersion
Although our goal is not to discuss results in terms of absolute modeled ages, we start by showing the horizontal distribution of these ages in the Carrizo Aquifer (Figure 2a), as calculated from Equations 1 and 2 and by combining Equations 3 and 4 for our original groundwater flow model calibrated with 4He concentrations (Castro and Goblet 2003a). All calculated ages are shown down to 60 km from the recharge area, where 14C content reaches ~1 pmc. Further away, the 14C content becomes negligible. It is clear that these ages differ in absolute values and evolve differently with respect to each other along the groundwater flowpath. 14C ages are the youngest along the entire flowpath, while ages obtained through direct simulation of groundwater age are younger than advective ages down to 20 km, to become progressively older than the latter up to 50 km from the recharge area. This trend is then reversed, with directly simulated ages becoming progressively younger than advective ages at ~60 km from the recharge area (Figure 2a). Although not shown, it should be noted that as distance from the recharge area increases, this trend is accentuated, with directly simulated ages becoming younger than advective ages up to tens of thousand years. For example, ~80 km from the recharge area, directly simulated ages are about 22,000 years younger than the latter. Similarly, with increased recharge distance, 14C ages become progressively younger than both advective and directly simulated ages (~18.5 and ~16.2 kyr younger at 60 km, respectively). This increasing age gap with increased recharge distance among all ages is the major feature observed.
The major hydrogeological change taking place along the groundwater flowpath in this system is a strong and progressive reduction of the horizontal velocity component, and therefore of the horizontal dispersive flux, up to 2 orders of magnitude 60 km from the recharge area (from 8.5 × 10⁻²⁷ to 1.7 × 10⁻²⁹ m/s). Tests carried out in total absence of diffusion show that, with the exception of the Wilcox, diffusion plays a negligible role in this portion of the system, due to the relatively high hydraulic conductivities in all formations. Diffusion impacts directly simulated groundwater ages at farther distances, where 14C is no longer detected and where hydraulic conductivities in the Recklaw are ≤ 10⁻¹⁰ m/s. Thus, diffusion will not be part of our discussion.
To assess the impact of horizontal dispersion on calculated 14C and directly simulated ages, a number of tests were carried out. For example, by reducing the dispersivity tensor 1 order of magnitude while maintaining all other parameters unchanged, the gap between ages increased (Figure 2b), with 14C ages ~22 kyr younger than directly simulated ages, as opposed to ~16 kyr in the original groundwater flow system, at 60 km from the recharge area.
On a separate set of simulations, hydraulic conductivities in the Carrizo and Recklaw outcrop areas were reduced threefold as compared to our original groundwater flow model. All other parameters remained unchanged. By creating the same decrease of hydraulic conductivities in these two formations, we have roughly maintained the original hydraulic head gradient in the system (see discussion by Patriarche et al. 2004), and the observed increase in advective ages should be proportional to this reduction in hydraulic conductivity and, therefore, velocity. This is what is observed when looking at the ratios between ages obtained in this particular groundwater flow system and those in the original one (Figure 2c). The observed increase in advective ages is roughly constant and threefold along the entire domain.
The same, however, is not true with respect to 14C and directly simulated ages. Specifically, all three modeling approaches display a similar behavior in areas where the water velocity is greater than ~3 × 10⁻²⁸ m/s, i.e., up to ~20 km from the recharge area (Figure 2c), where advection is dominant. For larger distances from the recharge area (~20 to 35 km) and lower velocity values (~3 × 10⁻²⁸ to 7 × 10⁻²⁹ m/s), the observed increase in 14C and directly simulated ages is similar and smaller than the one observed on advective ages. The most remarkable effect, however, is observed on 14C ages. Although in the first portion of the flowpath 14C ages, like advective and directly simulated ages, display a threefold increase, as distance from the recharge area increases and velocities decrease, 14C ages display a smaller and smaller age increase compared to the original flow system, to almost entirely ‘‘recover’’ and display ages that are very close to the original ones (~1.3 times higher) 60 km from the recharge area. Furthermore, the gap that was initially almost nonexistent between 14C and directly simulated ages up to 35 km from the recharge area became far more pronounced with increased recharge distance and decreasing velocities (less than ~7 × 10⁻²⁹ m/s).
From this set of simulations, a few important observations can be made: (1) kinematic dispersion impacts both 14C and directly simulated groundwater ages for velocities less than ~3 × 10⁻²⁸ m/s; (2) the influence of dispersion on both ages increases with decreasing velocities; and (3) the influence of longitudinal dispersion is far greater on 14C ages as compared to directly simulated ages for velocities less than ~7 × 10⁻²⁹ m/s. Observations 1 and 2 are in agreement with conclusions reached by Goode (1996) based on a set of simulations carried out in a hypothetical and simpler system. Dispersive and diffusive mixing of water (as verified here on directly simulated ages farther from the recharge area) tends to limit the maximum water ages. With respect to directly simulated groundwater ages, this is because, by analogy to Fick’s law applied to solutes, dispersive flux of age-mass occurs in the direction of decreasing ages, thus inducing a reduction in the water ages. As pointed out in Observation 3, however, this effect is more visible on 14C ages due to the presence of significant concentration gradients along the flowpath. Such gradients induce more 14C to move from higher to lower concentration areas, resulting in 14C ages that are much younger than the real water age.
In this situation, where there is a very strong reduction of the horizontal velocity field, horizontal dispersion acts as a ‘‘source’’ of 14C. This ‘‘source effect’’ is particularly important in low-water velocity areas where the role of dispersion becomes more prominent. Figure 2c shows that in this particular case, horizontal dispersion becomes an important source of 14C at distances ≥40 km where the horizontal velocity is less than or equal to ~7 × 10⁻²⁹ m/s. For higher velocity values, i.e., areas closer to the recharge area, the use of our modeling approach to determine groundwater ages based on 14C could be, in this situation, reliable.
This example shows that care must be taken when using 14C as a groundwater age indicator while neglecting the impact of dispersion. It also shows evidence for the higher reliability of this particular 14C groundwater dating method in groundwater systems where water velocities are relatively high, thus diminishing the role horizontal dispersion plays, in this particular case, as a source of 14C. Results presented here also seem to indicate that the modeling approach followed to determine 14C ages is likely to be less reliable in highly heterogeneous groundwater systems where hydraulic conductivities and thus water velocities vary over several orders of magnitude, and reach low values, compared to more homogeneous ones where velocities are high with only small variations (e.g., 1 order of magnitude or less). A similar conclusion concerning the use of chlorofluorocarbon-based ages for very young water (tens of years) was reached by Weissmann et al. (2002).
This degree of reliability of 14C ages in high—vs. low—water velocity areas due to the impact of horizontal dispersion can also be observed in 1D models as illustrated subsequently.
Impact of Horizontal Dispersion on 14C Ages—High vs. Low Horizontal Velocities
The general steady-state, 1D differential equation incorporating advection, dispersion, and radioactive decay along the flowpath with boundary conditions C(0) = C0 and C(N) = 0 is as follows:
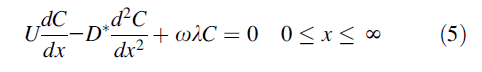
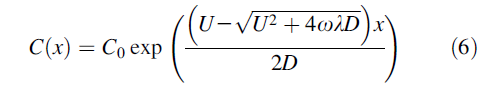
where D* is the coefficient of hydrodynamic dispersion, which includes molecular diffusion. The analytical solution to Equation 5 is given by:
where
![]()
and, therefore, molecular diffusion is not taken into account. Equation 6 can be rewritten as:
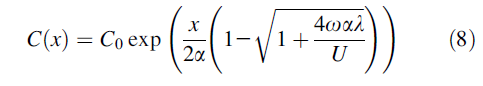
Depending on the value of the dimensionless number
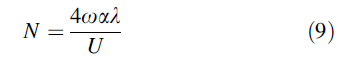
which incorporates the combined effects of advection, dispersion, and radioactive decay, a different approximation to Equation 8 can be obtained, thus emphasizing the driving mechanism:
- For N << 1, the approximate solution is:
This solution is valid for high water velocity values and is not dependent on the dispersivity. Here, radioactive decay is not significant, which leads to a quasi-linear concentration profile and thus absence of dispersion.
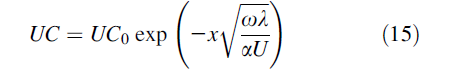
- For N >> 1, the approximate solution is:
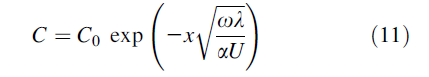
This solution is valid for low water velocity values and depends directly on the dispersivity. Radioactive decay plays a dominant role here, leading to an exponential concentration profile and hence the presence of a dispersive flux.
Using k = 3.84 × 10⁻¹²/s and x = 0.35, 14C concentrations were calculated through Equation 6 for high (8.5 × 10⁻²⁷ m/s) and low (1 × 10⁻¹⁰ m/s) water Darcy velocities, respectively. For both cases, three different dispersivity values (12.5, 125, and 1250 m) were tested. 14C ages were subsequently calculated using Equation 4.
1D simulation results clearly show (Figure 3a) that, for the high water velocity value, 14C age profiles obtained using Equation 6 for the three different dispersivities are undistinguishable, and thus that dispersion does not impact 14C concentrations and resulting 14C ages, as previously shown in the 2D simulations. In contrast, and as previously shown through the 2D model, 1D simulations conducted for lower velocity values clearly illustrate the impact of dispersion on 14C concentrations and resulting 14C ages (Figure 3b).
This 1D analysis further supports the idea that the modeling approach used here to determine 14C ages yields more reliable results in high water velocity areas where 14C ages are not affected by dispersion.
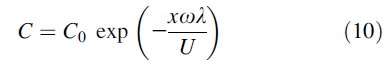
It can also be shown that the impact of dispersion on 14C concentration profiles and resulting 14C ages is directly related to the ratio of advective to dispersive flux, not on the absolute dispersive flux value alone. Specifically, this impact is negligible for high values of this ratio. The impact of dispersion on 14C ages increases progressively as the advective/dispersive flux ratio decreases and becomes significant for low values of the latter. This dependency can be directly illustrated in a 1D analysis by using our derived solutions for high (Equation 10) and low (Equation 11) water velocity values and the corresponding parameter values used in both examples. We illustrate this subsequently.
From Equation 10, the advective and dispersive fluxes are given by:
and
respectively. Thus, for high water velocities, the advective/dispersive flux ratio is:
respectively. Thus, for high water velocities the advective/dispersive flux ratio is:
Similarly, from Equation 11, advective and dispersive fluxes are given by:
and
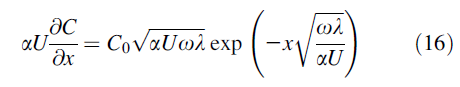
respectively. Thus, for low water velocities the advective/dispersive flux ratio is:
For a = 125 m, the advective/dispersive flux ratios calculated using Equations 14 (U = 8.5 × 10⁻⁷ m/s) and 17 (U = 1 × 10⁻¹⁰ m/s) yield 5000 and 0.8, respectively. This shows that the impact of dispersion on 14C ages is indeed dependent on the advective/dispersive flux ratio and is only significant when this ratio is small. The 1D analysis presented here is simply meant to illustrate theoretically how the impact of horizontal dispersion on 14C ages is dependent on the horizontal velocity value. It is also meant to illustrate how this impact, through its dependency on the coupled advective-dispersive fluxes, becomes more prominent with decreasing velocities and thus with decreasing dispersive fluxes. However, through a 1D analysis, it is not possible to evaluate simultaneously the role of horizontal and transverse dispersion as well as the impact of mixing due to cross-formational flow, mixing mechanisms that impact concentration profiles and groundwater ages. We thus proceed to analyze the impact of all mixing processes on our three modeling approaches through a 2D analysis.
Vertical Age Structure
A detailed analysis of the age structure along a vertical plane of all calculated ages in our original groundwater flow system (Figure 2a) 50 km from the recharge area reveals some interesting results (Figure 4). This includes the Carrizo Aquifer, the overlying confining layer (Recklaw), and the Queen City Aquifer. This complex vertical age structure is essentially the result of the combined effects of mixing due to advection and horizontal and vertical dispersion.
As expected, vertical advective ages in the Carrizo Aquifer display an almost total absence of age gradient. This is because horizontal velocities are similar throughout the entire thickness of the aquifer along the same vertical, with water moving as ‘‘packets’’ along streamlines downgradient (see discussion by Bethke and Johnson 2002b) without exchanging water with neighboring formations (closed system). By contrast, 14C and directly simulated groundwater ages show a strong vertical age gradient. Groundwater becomes progressively younger from bottom to top (Figure 4). At the bottom of the Carrizo, mixing with older water from the neighboring confining layer is occurring through vertical dispersion, in addition to some 14C exiting the system toward the Wilcox through diffusion. Toward the top of the Carrizo, the vertical dispersion component carrying older water from the bottom becomes smaller, allowing horizontal dispersion to dominate over the vertical component, rendering younger 14C and directly simulated groundwater ages. Comparison between ages shows once again the influence of horizontal dispersion on 14C ages, the latter being younger than directly simulated ages throughout the entire thickness of the Carrizo due to this artificial source of 14C.
At the interface of the confining layer, cross-formational flow is greatly facilitated through vertical dispersion as opposed to advection (Figure 4). Advective ages in the Recklaw Formation are higher than those in the Carrizo, which is opposite to 14C and directly simulated groundwater ages. At the interface with the Queen City, however, the situation is reversed compared to that observed in the Carrizo. In the Queen City, 14C ages are now the oldest throughout most of the thickness, and a vertical age gradient is absent (Figure 4). The dominant age factor on 14C ages in the Queen City is now the combined effect of vertical dispersion and advection through vertical upward leakage in the Recklaw, which brings a constant flux of older water with lower 14C content originating in the Carrizo. Here, vertical dispersion acts as a ‘‘sink’’ of 14C. By contrast, and as streamlines in the Queen City (which originate in the Carrizo recharge area) become shorter and shorter toward the top of the aquifer, advective ages display a vertical age gradient here, becoming progressively younger toward the surface. In addition to younger advective water arriving into the Queen City, horizontal dispersion also renders directly simulated groundwater ages younger upward. This results in directly simulated ages younger than advective ages, which is the reverse of what is observed in the Carrizo.
Analysis of the vertical age structure in this complex system is important as it illustrates how the combined effect of mixing processes (e.g., advection, horizontal and vertical dispersion, as well as cross-formational flow) might cause very different vertical age structures in different areas/formations of one particular system while using the same dating method. It also illustrates, depending on the formation of interest, how these ages might evolve with respect to each other in unexpected ways. One last important observation to note is that unlike modeled advective and 14C ages, directly simulated groundwater ages display a consistent behavior in the Carrizo and Queen City aquifers, with older ages at the bottom, younger toward the top. Such consistency likely indicates that, when mixing processes are relevant in a particular groundwater flow system, direct simulation of groundwater age will yield more realistic results than the advective and 14C modeling approaches as described here.
Impact of Faults on Calculated Ages
We also investigated the potential impact of both high- and low-permeability faults that might be present not only within one particular aquifer but also in surrounding confining layers. The presence of faults in sedimentary systems is not uncommon, and a number of local faults are well documented in the Carrizo Aquifer and surrounding formations in our study area (Figure 1b). We carried out a series of simulations in which a fault with a length of ~12.5 m (the smallest element length in our original mesh) was placed ~27 km from the Carrizo recharge area in different formations. Through this set of simulations, variable hydraulic conductivity values were attributed to this fault. With the exception of this newly introduced fault, all other parameters and boundary conditions remained unchanged (Figure 1c; Castro and Goblet 2003a). Here, we present results of two different sets of simulations, the first representing a low-permeability fault placed in the Carrizo, and the second representing a high-permeability fault located in the overlying confining layer, the Recklaw Formation. Low- and high-permeability faults with hydraulic conductivities several orders of magnitude different from the values used in the simulations presented here all reveal similar trends.
Low-Permeability Fault in the Carrizo Aquifer
A hydraulic conductivity of 5 × 10⁻²⁹ m/s was assigned to a fault introduced in the Carrizo Aquifer. The presence of this low-permeability fault gave origin to a groundwater flow system far more complex than the original one (Figure 1c), complexity that is directly translated to calculated groundwater ages (Figure 5a). Changes in the groundwater flow system induced by the presence of this fault, from the recharge area down to its location, include a relatively small reduction of the horizontal velocity component simultaneously with an increase of the vertical velocity. The most remarkable changes, however, are observed on the opposite side of the fault. Here, a strong reduction of the hydraulic gradient, and therefore of the velocity field, is observed. In addition, in the vicinity of the fault, the direction of vertical leakage in the Recklaw Formation was reversed and is now downward and much smaller (~2 orders of magnitude) than that of the original groundwater flow system. The new modeled water ages show these changes in a clear fashion. Between the recharge area and up to the fault location, all ages follow a similar aging trend, and no important differences between advective, 14C, and directly simulated groundwater ages behavior can be observed. This is because between the recharge area and the fault location, horizontal advection is by far the dominant transport process affecting all calculated ages. This behavior is consistent with previous results (e.g., Figure 2c). On the opposite side of the fault, however, and due to the strong reduction of the velocity field, all ages are now much older than the original ones, and important discrepancies between their aging behavior are observed (Figure 5a): (1) advective ages display the highest aging rate along the entire trajectory, down to 60 km from the recharge area and (2) near the fault, between ~27 and 35 km, aging of 14C ages is more pronounced than that of directly simulated groundwater ages. Simulated 14C concentration distribution shows that a local concentric area with unusually low 14C concentrations has now developed in the Recklaw Formation, near the fault. These unusually low 14C concentrations are due to the very slow water movement in this confining layer. As leakage is now downward, almost stagnant water with very low 14C content mix with Carrizo water, resulting in a higher aging rate than directly simulated groundwater ages. Further away, at ~40 km and as previously verified, horizontal dispersion plays once again an important role on 14C and directly simulated groundwater ages, and the expected behavior is observed, with 14C ages becoming progressively younger than directly simulated ages with increased distance from the recharge area and decreasing velocities.
High-Permeability Fault in the Recklaw Formation
To assess the potential impact on calculated water ages of a permeable fault located in a neighboring confining layer, a hydraulic conductivity value of 10²² m/s was assigned to a fault placed in the Recklaw Formation. Once again, the presence of such a fault gave rise to major changes in the groundwater flow system, which, in turn, resulted in important changes and distinct behavior on calculated water ages (Figure 5b). Here, horizontal flow between the recharge area and the fault is greatly enhanced, resulting in advective, 14C, and directly simulated groundwater ages that are now younger compared to those of the original groundwater flow system. As upward leakage flux in the Recklaw Formation is smaller, less water exits the Carrizo vertically, rendering directly simulated ages and, particularly, 14C ages younger compared to advective ones. On the opposite side of the fault, at ~30 km, the situation is reversed. The presence of the fault has now induced a very strong upward water movement through the Recklaw, in addition to an important reduction of water velocities in the Carrizo. As a result, 14C now exits the Carrizo Aquifer upwards at a much higher rate in the fault area, leading to a much lower 14C content in this aquifer on the opposite side of the fault as compared to the original groundwater flow system. Consequently, between the fault location and ~40 km from the recharge area, 14C ages now at a higher rate than advective and directly simulated groundwater ages (Figure 5b). This upward water movement affects also the directly simulated groundwater ages, although not to the same extent, as previously discussed. In this particular case, and for a relatively short distance, between ~27 and 40 km from the recharge area, advective ages are less affected by aging, while directly simulated groundwater ages occupy an intermediate position. Note that despite the fact that advective ages are considerably older here compared to the original groundwater flow system due to a reduction of the velocity field, the observed increase of 14C and directly simulated ages is well in excess relative to advective ages due simply to mixing processes.
Thus, the distance between the fault and the recharge area remains critical to the behavior of the flow system and its associated ages.
Calculated 14C Ages Based on C Isotope Measurements
Simulations presented here were carried out in a complex groundwater flow system, the Carrizo Aquifer and surrounding formations, in which the presence of local faults is well known. As pointed out earlier, in this system, based on C isotope measurements available in a number of water samples (Figure 1b; Castro et al., 2000), 14C ages were previously estimated following the traditional approach in which mixing processes are not considered (Castro et al., 2000). Only radioactive decay and chemical interactions were taken into account, and no attempt was made to simulate 14C transport in the system with incorporation of mixing processes (Castro et al., 2000). Subsequent comparison of these calculated 14C ages with modeled advective ages (Castro and Goblet, 2003a), and those obtained through direct simulation of groundwater age (Castro and Goblet, 2003b), shows strong discrepancies at several locations (Figure 6). Such discrepancies are particularly strong between calculated 14C ages based on C isotope measurements (Castro et al., 2000) and modeled advective and directly simulated groundwater ages. It is clear that at certain locations (samples TX01, TX24, and TX08, Figure 6), 14C yields apparent ages that are far older than advective and directly simulated ages. In addition, at two locations (TX28 and TX03) where the presence of 14C was expected based on modeling results, 14C was below detection limit (Figure 6). Importantly, farther from the recharge area (samples TX04 and TX14; Figure 1b), where velocities are smaller and the impact of dispersion is more prominent, 14C ages are younger than modeled advective and directly simulated groundwater ages (Figure 6). Here, our simulations suggest that mixing with younger water takes place as directly simulated groundwater ages become younger than advective ages (sample TX14; Figure 6). Although we cannot be fully confident that these observed discrepancies in the Carrizo Aquifer are the combined result of groundwater mixing due to the presence of faults, cross-formational flow through advection, and the impact of both longitudinal and transverse dispersion, the situation observed in the field appears to be consistent with some of the simulation results presented here.
Concluding Remarks
With the set of 2D simulations presented here, we have shown how, due to mixing processes and particularly due to advection and dispersion, modeled advective, 14C, and directly simulated groundwater ages evolve differently with respect to each other. The impact of dispersion is particularly strong on ages obtained through simulation of 14C as this mixing process may act as an important source or sink for 14C in the presence of significant concentration gradients. Mixing processes due to advection and dispersion may also give rise to unexpected modeled vertical age profiles. The impact of dispersion on modeled 14C and directly simulated groundwater ages is systematically stronger in areas where velocities are smaller, as dispersive flux will occur in the direction of either decreasing ages (direct simulation of groundwater age) or decreasing concentrations (modeled 14C ages). Specifically, in the system considered here, the impact of dispersion on these calculated ages becomes nonnegligible for water velocities less than ~3 × 10^-28 m/s, and is particularly pronounced on modeled 14C ages for velocities less than ~7 × 10^-29 m/s. We also illustrate through a 1D analysis the effect of horizontal dispersion on 14C ages, which depends directly on the ratio of advective to dispersive flux, not on the dispersive flux value alone. The impact of dispersion becomes more prominent with decreasing velocities and thus with decreasing dispersive fluxes. Specifically, this impact is significant for low ratios of advective to dispersive flux and decreases as the ratio increases. Longitudinal dispersion acts generally as a source of 14C within a particular aquifer, while vertical dispersion acts as a sink for 14C both within a single aquifer by enhancing mixing with older water located at greater depths or when crossing confining layers. Thus, depending on how dispersion contributes to additions or losses of 14C, older or younger apparent modeled 14C ages relative to the actual age of groundwater might be observed.
The impact of faults on modeled water ages was also assessed. Depending on fault locations (aquifers vs. aquitards) and on its degree of permeability, advective, 14C, and directly simulated groundwater ages will evolve in very different ways, leading potentially to local differences in modeled ages up to many thousands of years. Our modeling approach for 14C dating (i.e., 14C ages) has a particularly distinct behavior in complex groundwater flow systems where extremely strong variations of the velocity field are present, in addition to the presence of local faults. Here, mixing due to cross-formational flow as well as dispersion may impact significantly the modeled 14C concentrations.
Simulations presented here were carried out in a complex groundwater flow system, the Carrizo Aquifer and surrounding formations, in which the presence of local faults is well known. Here, previous calculations of advective (Castro and Goblet, 2003a), 14C (Castro et al., 2000), and directly simulated groundwater ages (Castro and Goblet, 2003b) show the presence of strong discrepancies at several locations. Specifically, discrepancies are particularly strong between 14C calculated based on C isotope measurements neglecting mixing processes (Castro et al., 2000) and modeled advective and directly simulated groundwater ages. Although we cannot be fully confident that these observed discrepancies in the Carrizo Aquifer are the combined result of mixing processes due to advection and dispersion enhanced locally by the presence of faults, the situation observed in the field is certainly consistent with some of the simulation results presented here. Ideally, 14C ages should be estimated by taking into account all physical and chemical processes affecting its concentration in order to systematically obtain 14C ages that are close to the real age of groundwater. Overall, direct simulation of groundwater ages seems to yield more consistent results than the modeling approaches employed here for calculation of advective and 14C ages when mixing processes in a particular groundwater flow system are nonnegligible and water velocities vary over several orders of magnitude within one single aquifer. Specifically, and unlike the two other modeling approaches, directly simulated ages display a consistent (or expected) vertical age structure in all formations, with older ages at the bottom, younger toward the top. The modeling approach employed here for calculation of 14C ages will yield more consistent results in systems where groundwater velocities are high and exhibit small variation, in addition to systems where faults are absent. Modeled advective ages will yield water ages that are representative of the real system only when mixing processes can be neglected. The latter are thus the most restrictive.
Acknowledgments
The authors thank M. P. Anderson, W. Sanford, G. Weissmann, and P. Binning for their insightful and thorough reviews, which led to a much improved final version of this manuscript. Financial support from the National Science Foundation grant EAR-03087 07 and the Elizabeth Caroline Crosby Research Award (NSF ADVANCE at the University of Michigan) is greatly appreciated.
References
Bethke, C.M., and T.M. Johnson. 2002a. Paradox of groundwater age. Geology 30, no. 2: 107–110.
Bethke, C.M., and T.M. Johnson. 2002b. Ground water age. Ground Water 40, no. 4: 337–339.
Castro, M.C. 2004. Helium sources in passive margin aquifers—New evidence for a significant mantle 3He source in aquifers with unexpectedly low in-situ 3He/4He production. Earth Planetary Science Letters 222, no. 3–4: 897–913.
Castro, M.C., and P. Goblet. 2003a. Calibration of regional groundwater flow models—Working toward a better understanding of site-specific systems. Water Resources Research 39, no. 6: 13-1–13-24.
Castro, M.C., and P. Goblet. 2003b. Noble gas thermometry and hydrologic ages: Evidence for late Holocene warming in Southwest Texas. Geophysical Research Letters 30, no. 24: 2-1–2-4.
Castro, M.C., M. Stute, and P. Schlosser. 2000. Comparison of 4He and 14C ages in simple aquifer systems: Implications for groundwater flow and chronologies. Applied Geochemistry 15, no. 8: 1137–1167.
Goode, D.J. 1996. Direct simulation of groundwater age. Water Resources Research 32, no. 2: 289–296.
Hamlin, H.S. 1988. Depositional and groundwater flow systems of the Carrizo-Upper Wilcox, South Texas. Austin, Texas: Bureau of Economic Geology, Report of Investigations, 175.
Johnson, T.M., and D.J. DePaolo. 1996. Reaction-transport models for radiocarbon in groundwater: The effects of longitudinal dispersion and the use of Sr isotope ratios to correct for water-rock interaction. Water Resources Research 32, no. 7: 2203–2212.
Li, Y.-H., and S. Gregory. 1974. Diffusion of ions in sea water and in deep sea sediments. Geochimica et Cosmochimica Acta 38, no. 5: 703–714.
Mann, W.B., W.F. Marlow, and E.E. Hughes. 1961. Half-life of carbon-14. International Journal of Applied Radiation and Isotopes 11, no. 1: 57.
Patriarche, D., Castro, M.C., and Goblet, P. 2004. Large-scale hydraulic conductivities inferred from three-dimensional groundwater flow and 4He transport modeling in the Carrizo aquifer, Texas. Journal of Geophysical Research 109: 1–19.
Phillips, F.M., and M.C. Castro. 2003. Groundwater dating and residence-time measurements. In Treatise on Geochemistry, ed. H.D. Holland and K.K. Turekian, vol. 5: Surface and Ground Water, Weathering, and Soils, ed. J.I. Drever, 451–497. Oxford, U.K.: Elsevier.
Pint, C.D., R.J. Hunt, and M.P. Anderson. 2003. Flowpath delineation and groundwater age, Allequash Basin, Wisconsin. Ground Water 41, no. 7: 895–902.
Plummer, L.N., E.C. Prestemon, and D.L. Parkhurst. 1991. An interactive code (NETPATH) for modeling net geochemical reactions along a flow path. Reston, Virginia: USGS Water-Resources Investigations Report 91–4078.
Sanford, W.E. 1997. Correcting for diffusion in carbon-14 dating of groundwater. Ground Water 35, no. 2: 357–361.
Sanford, W.E., and S. Buapeng. 1996. Assessment of a groundwater flow model of the Bangkok Basin, Thailand, using carbon-14-based ages and paleohydrology. Hydrogeology Journal 4, no. 4: 26–40.
Stute, M., P. Schlosser, J.F. Clark, and W.S. Broecker. 1992. Paleotemperatures in the southwestern United States derived from noble gas measurements in groundwater. Science 256, no. 5059: 1000–1003.
Sudicky, E.A., and E.O. Frind. 1981. Carbon 14 dating of groundwater in confined aquifers: Implications of aquitard diffusion. Water Resources Research 17, no. 4: 1060–1064.
Varni, M., and J. Carrera. 1998. Simulation of groundwater distributions. Water Resources Research 34, no. 12: 3271–3281.
Walker, G.R., and P.G. Cook. 1991. The importance of considering diffusion when using carbon-14 to estimate groundwater recharge to an unconfined aquifer. Journal of Hydrology 128, no. 1–4: 41–48.
Wang, J.H., C.V. Robinson, and I.S. Edelman. 1953. Self-diffusion and structure of liquid water. III. Measurement of self-diffusion of liquid water with H2, H3, and O18 as tracers. Journal of American Chemical Society 75, no. 2: 466–470.
Weissmann, G.S., Y. Zhang, E.M. LaBolle, and G.E. Fogg. 2002. Dispersion of groundwater age in an alluvial aquifer system. Water Resources Research 38, no. 10: 16-1–16-13.
Weyhenmeyer, C.E., S.J. Burns, H.N. Waber, W. Aeschbach-Hertig, R. Kipfer, H.H. Loosli, and A. Matter. 2000. Cool glacial temperatures and changes in moisture source recorded in Oman groundwaters. Science 287, no. 5454: 842–845.


 被折叠的 条评论
为什么被折叠?
被折叠的 条评论
为什么被折叠?
 到【灌水乐园】发言


