


最近接手的React中项目中,出现了利用Echarts与Echarts-gl构建3D立体环形图的任务,环形中间部分还需展示数据名称与数据值,本人在各个技术网站都看了一遍,未发现可以的CV的代码,不得已在与同事的合作中,实现了一下版本的初步效果,勉强能看,不喜勿喷
在React中 引入 echarts与echarts-gl,不多说,直接上代码
// 引入echarts与echarts-gl
// 当前使用版本
// "echarts": "^5.3.3",
// "echarts-gl": "^2.0.8",
import "echarts-gl";
import * as echarts from 'echarts';
// 定义一个div标签
<div id="pieEcharts"> </div>
// 创建模拟数据
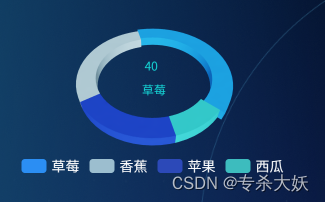
let monitoringAreaData = [
{name: '草莓', value: 40, itemStyle: {color: '#2B8EF3'}, opacity: '65%'},
{name: '香蕉', value: 30, itemStyle: {color: '#9CBECF'}, opacity: '65%'},
{name: '苹果', value: 20, itemStyle: {color: '#2C49B8'}, opacity: '65%'},
{name: '西瓜', value: 10, itemStyle: {color: '#3DBCBE'}, opacity: '65%'},
]
// 构建3D立体环形图
let pieOption = () => {
// devicePixelRatio: 设备像素比,默认取浏览器的值window.devicePixelRatio
let myChart = echarts.init(document.getElementById('pieEcharts'), null, {devicePixelRatio: 2})
// 传入数据生成 option
let option = getPie3D(monitoringAreaData, 0.75, 10);
myChart.setOption(option);
// 添加事件
bindListen(myChart, option, 10)
}
// 生成模拟 3D 饼图的配置项
let getPie3D = (pieData, internalDiameterRatio, height) => {
let series = [];
let sumValue = 0;
let startValue = 0;
let endValue = 0;
let legendData = [];
let k = typeof internalDiameterRatio !== 'undefined' ? (1 - internalDiameterRatio) / (1 + internalDiameterRatio) : 1 / 3;
// 为每一个饼图数据,生成一个 series-surface 配置
for (let i = 0; i < pieData.length; i++) {
sumValue += pieData[i].value;
let seriesItem = {
name: typeof pieData[i].name === 'undefined' ? `series${i}` : pieData[i].name,
type: 'surface',
parametric: true,
wireframe: {
show: false
},
pieData: pieData[i],
pieStatus: {
selected: false,
hovered: false,
k: k
},
}
if (typeof pieData[i].itemStyle != 'undefined') {
let itemStyle = {};
typeof pieData[i].itemStyle.color != 'undefined' ? itemStyle.color = pieData[i].itemStyle.color : null;
typeof pieData[i].itemStyle.opacity != 'undefined' ? itemStyle.opacity = pieData[i].itemStyle.opacity : null;
seriesItem.itemStyle = itemStyle;
}
series.push(seriesItem);
}
// 使用上一次遍历时,计算出的数据和 sumValue,调用 getParametricEquation 函数,
// 向每个 series-surface 传入不同的参数方程 series-surface.parametricEquation,也就是实现每一个扇形。
let linesSeries = [];
for (let i = 0; i < series.length; i++) {
endValue = startValue + series[i].pieData.value;
series[i].pieData.startRatio = startValue / sumValue;
series[i].pieData.endRatio = endValue / sumValue;
series[i].parametricEquation = getParametricEquation(series[i].pieData.startRatio, series[i].pieData.endRatio, false, i === 0, k, height ? height : 10);
startValue = endValue;
legendData.push(series[i].name);
}
series = series.concat(linesSeries)
// 设置一个 2D环形图,在环形图中间展示数据名称与数据值
series.push({
name: 'Access From',
type: 'pie',
// 环形图的内环与外环占比
radius: ['40%', '70%'],
avoidLabelOverlap: false,
label: {
show: false,
position: 'center',
},
itemStyle: {
// 控制2D环形图的显隐 0 隐藏 1 显示
opacity: 0
},
emphasis: {
label: {
show: true,
color: '#14D8D8',
opacity: 1,
fontFamily: 'Source Han Sans CN',
fontWeight: 350,
fileSize: 20,
formatter: '{c} \n \n {b}',
}
},
labelLine: {
show: false
},
clockwise: false,
startAngle: 320,
data: monitoringAreaData
});
// 准备待返回的配置项,把准备好的 legendData、series 传入。
let option = {
legend: {
data: legendData,
bottom: 0,
textStyle: {
color: 'white',
fontFamily: 'Source Han Sans CN',
fontSize: 14,
}
},
label: {
show: true
},
xAxis3D: {
min: -1,
max: 1
},
yAxis3D: {
min: -1,
max: 1
},
zAxis3D: {
min: -2,
max: 2
},
grid3D: {
show: false,
boxHeight: 3, //圆环的高度
viewControl: {//3d效果可以放大、旋转等,请自己去查看官方配置
alpha: 45, // 调整视图角度
distance: 170,//调整视角到主体的距离,类似调整zoom
rotateSensitivity: 0, //设置为0无法旋转
zoomSensitivity: 0, //设置为0无法缩放
panSensitivity: 0, //设置为0无法平移
autoRotate: false
},
//后处理特效可以为画面添加高光、景深、环境光遮蔽(SSAO)、调色等效果。可以让整个画面更富有质感。
postEffect: {//配置这项会出现锯齿,请自己去查看官方配置有办法解决
enable: true,
bloom: {
enable: true,
bloomIntensity: 1
},
SSAO: {
enable: true,
quality: 'medium',
radius: 2
}
}
},
series: series
};
return option;
}
// startRatio(浮点数): 当前扇形起始比例,取值区间[0, endRatio)
// endRatio(浮点数): 当前扇形结束比例,取值区间(startRatio, 1]
// isSelected(布尔值): 是否选中,效果参照二维饼图选中效果(单选)
// isHovered(布尔值): 是否放大,效果接近二维饼图高亮(放大)效果(未能实现阴影)
// k(0~1之间的浮点数):用于参数方程的一个参数,取值 0~1 之间,通过「内径 / 外径」的值换算而来。
//height配置3d扇形高度
const getParametricEquation = (startRatio, endRatio, isSelected, isHovered, k, height) => {
// 计算
let midRatio = (startRatio + endRatio) / 2;
let startRadian = startRatio * Math.PI * 2;
let endRadian = endRatio * Math.PI * 2;
let midRadian = midRatio * Math.PI * 2;
// 通过扇形内径/外径的值,换算出辅助参数 k(默认值 1/3)
k = typeof k !== "undefined" ? k : 1 / 3;
// 计算选中效果分别在 x 轴、y 轴方向上的位移(未选中,则位移均为 0)
let offsetX = isSelected ? Math.cos(midRadian) * 0.1 : 0;
let offsetY = isSelected ? Math.sin(midRadian) * 0.1 : 0;
// 计算高亮效果的放大比例(未高亮,则比例为 1)
let hoverRate = isHovered ? 1.05 : 1;
// 返回曲面参数方程
return {
u: {
min: -Math.PI,
max: Math.PI * 3,
step: Math.PI / 32,
},
v: {
min: 0,
max: Math.PI * 2,
step: Math.PI / 20,
},
x: (u, v) => {
if (u < startRadian) {
return (
offsetX + Math.cos(startRadian) * (1 + Math.cos(v) * k) * hoverRate
);
}
if (u > endRadian) {
return (
offsetX + Math.cos(endRadian) * (1 + Math.cos(v) * k) * hoverRate
);
}
return offsetX + Math.cos(u) * (1 + Math.cos(v) * k) * hoverRate;
},
y: (u, v) => {
if (u < startRadian) {
return (
offsetY +
Math.sin(startRadian) * (1 + Math.cos(v) * k) * hoverRate
);
}
if (u > endRadian) {
return (
offsetY +
Math.sin(endRadian) * (1 + Math.cos(v) * k) * hoverRate
);
}
return offsetY + Math.sin(u) * (1 + Math.cos(v) * k) * hoverRate;
},
z: (u, v) => {
if (u < -Math.PI * 0.5) {
return Math.sin(u);
}
if (u > Math.PI * 2.5) {
return Math.sin(u);
}
return Math.sin(v) > 0 ? 1 * height : -1;
}
}
}
const bindListen = (myChart, option, height) => {
// 监听鼠标事件,实现饼图选中效果(单选),近似实现高亮(放大)效果。
let selectedIndex = '';
let hoveredIndex = '';
// 设置默认展示数据
let defaultIndex = 0;
// 与2D环形图的数据参数有关,可设置默认相中
myChart.dispatchAction({
type: 'highlight',
// 第四个series中展示中的默认数值
seriesIndex: 4,
dataIndex: defaultIndex,
});
// 监听点击事件,实现选中效果(单选)
myChart.on('click', (params) => {
// 从 option.series 中读取重新渲染扇形所需的参数,将是否选中取反。
let isSelected = !option.series[params.seriesIndex].pieStatus.selected;
let isHovered = option.series[params.seriesIndex].pieStatus.hovered;
let k = option.series[params.seriesIndex].pieStatus.k;
let startRatio = option.series[params.seriesIndex].pieData.startRatio;
let endRatio = option.series[params.seriesIndex].pieData.endRatio;
// 如果之前选中过其他扇形,将其取消选中(对 option 更新)
if (selectedIndex !== '' && selectedIndex !== params.seriesIndex) {
option.series[selectedIndex].parametricEquation = getParametricEquation(option.series[selectedIndex].pieData.startRatio, option.series[selectedIndex].pieData.endRatio, false, false, k, 21);
option.series[selectedIndex].pieStatus.selected = false;
}
// 对当前点击的扇形,执行选中/取消选中操作(对 option 更新)
option.series[params.seriesIndex].parametricEquation = getParametricEquation(startRatio, endRatio, isSelected, isHovered, k, 10);
option.series[params.seriesIndex].pieStatus.selected = isSelected;
// 如果本次是选中操作,记录上次选中的扇形对应的系列号 seriesIndex
isSelected ? selectedIndex = params.seriesIndex : null;
// 使用更新后的 option,渲染图表
myChart.setOption(option);
});
// 监听 mouseover,近似实现高亮(放大)效果
myChart.on('mouseover', (params) => {
// 准备重新渲染扇形所需的参数
let isSelected;
let isHovered;
let startRatio;
let endRatio;
let k;
// 2D环形图 设置默认数据展示
if (params.dataIndex != defaultIndex) {
myChart.dispatchAction({
type: 'downplay',
seriesIndex: 4,
dataIndex: defaultIndex,
});
}
// 如果触发 mouseover 的扇形当前已高亮,则不做操作
if (hoveredIndex === params.seriesIndex) {
return;
// 否则进行高亮及必要的取消高亮操作
} else {
// 如果当前有高亮的扇形,取消其高亮状态(对 option 更新)
if (hoveredIndex !== '') {
// 从 option.series 中读取重新渲染扇形所需的参数,将是否高亮设置为 false。
isSelected = option.series[hoveredIndex].pieStatus.selected;
isHovered = false;
startRatio = option.series[hoveredIndex].pieData.startRatio;
endRatio = option.series[hoveredIndex].pieData.endRatio;
k = option.series[hoveredIndex].pieStatus.k;
// 对当前点击的扇形,执行取消高亮操作(对 option 更新)
option.series[hoveredIndex].parametricEquation = getParametricEquation(startRatio, endRatio, isSelected, isHovered, k, height ? height : 10);
option.series[hoveredIndex].pieStatus.hovered = isHovered;
// 将此前记录的上次选中的扇形对应的系列号 seriesIndex 清空
hoveredIndex = '';
}
// 如果触发 mouseover 的扇形不是透明圆环,将其高亮(对 option 更新)
if (params.seriesName !== 'mouseoutSeries') {
// 从 option.series 中读取重新渲染扇形所需的参数,将是否高亮设置为 true。
isSelected = option.series[params.seriesIndex].pieStatus.selected;
isHovered = true;
startRatio = option.series[params.seriesIndex].pieData.startRatio;
endRatio = option.series[params.seriesIndex].pieData.endRatio;
k = option.series[params.seriesIndex].pieStatus.k;
// 对当前点击的扇形,执行高亮操作(对 option 更新)
option.series[params.seriesIndex].parametricEquation = getParametricEquation(startRatio, endRatio, isSelected, isHovered, k, height ? height : 10);
option.series[params.seriesIndex].pieStatus.hovered = isHovered;
// 记录上次高亮的扇形对应的系列号 seriesIndex
hoveredIndex = params.seriesIndex;
}
// 使用更新后的 option,渲染图表
myChart.setOption(option);
}
});
// 修正取消高亮失败的 bug
myChart.on('globalout', () => {
let isSelected;
let isHovered;
let startRatio;
let endRatio;
let k;
if (hoveredIndex !== '') {
// 从 option.series 中读取重新渲染扇形所需的参数,将是否高亮设置为 true。
isSelected = option.series[hoveredIndex].pieStatus.selected;
isHovered = false;
k = option.series[hoveredIndex].pieStatus.k;
startRatio = option.series[hoveredIndex].pieData.startRatio;
endRatio = option.series[hoveredIndex].pieData.endRatio;
// 对当前点击的扇形,执行取消高亮操作(对 option 更新)
option.series[hoveredIndex].parametricEquation = getParametricEquation(startRatio, endRatio, isSelected, isHovered, k, height ? height : 10);
option.series[hoveredIndex].pieStatus.hovered = isHovered;
// 将此前记录的上次选中的扇形对应的系列号 seriesIndex 清空
hoveredIndex = '';
}
// 使用更新后的 option,渲染图表
// myChart.setOption(option);
// 鼠标移出后重新渲染3D环形图
pieOption()
});
}
大家有什么好的方法,可以互相交流学习,第一次写文章,请大家多多包涵
本文借鉴了以下文章,
Documentation - Apache ECharts


 2万+
2万+

 被折叠的 条评论
为什么被折叠?
被折叠的 条评论
为什么被折叠?
 到【灌水乐园】发言


