


上次做的那个电商产品预测后面运用起来发现有很多不足的地方,所以这次整个升级了一下,进行了新的模块化设计,尤其是在数据填充部分有了很多新想法。可视化也进行了一个大升级,可交互性提高了特别多。
之前写的——基于大模型的【电商商品价格与库存】智能预测
这第二版价格库存预测,从数据样本处理——deepseek处理——数据填充——可视化都已实现且跑通,目前是能预测未来6个月的商品价格趋势和库存变化,之后有新想法我也会不断更新,希望大家享用愉快!
项目背景
在电商领域,准确预测商品价格和库存变化对于商家的库存管理和定价策略至关重要。本项目开发了一个基于AI的预测系统,通过分析历史数据,预测未来6个月的价格和库存趋势,帮助商家:
- 优化库存管理,避免积压和断货
- 制定合理的定价策略,提高竞争力
- 把握市场趋势,提前做好运营规划
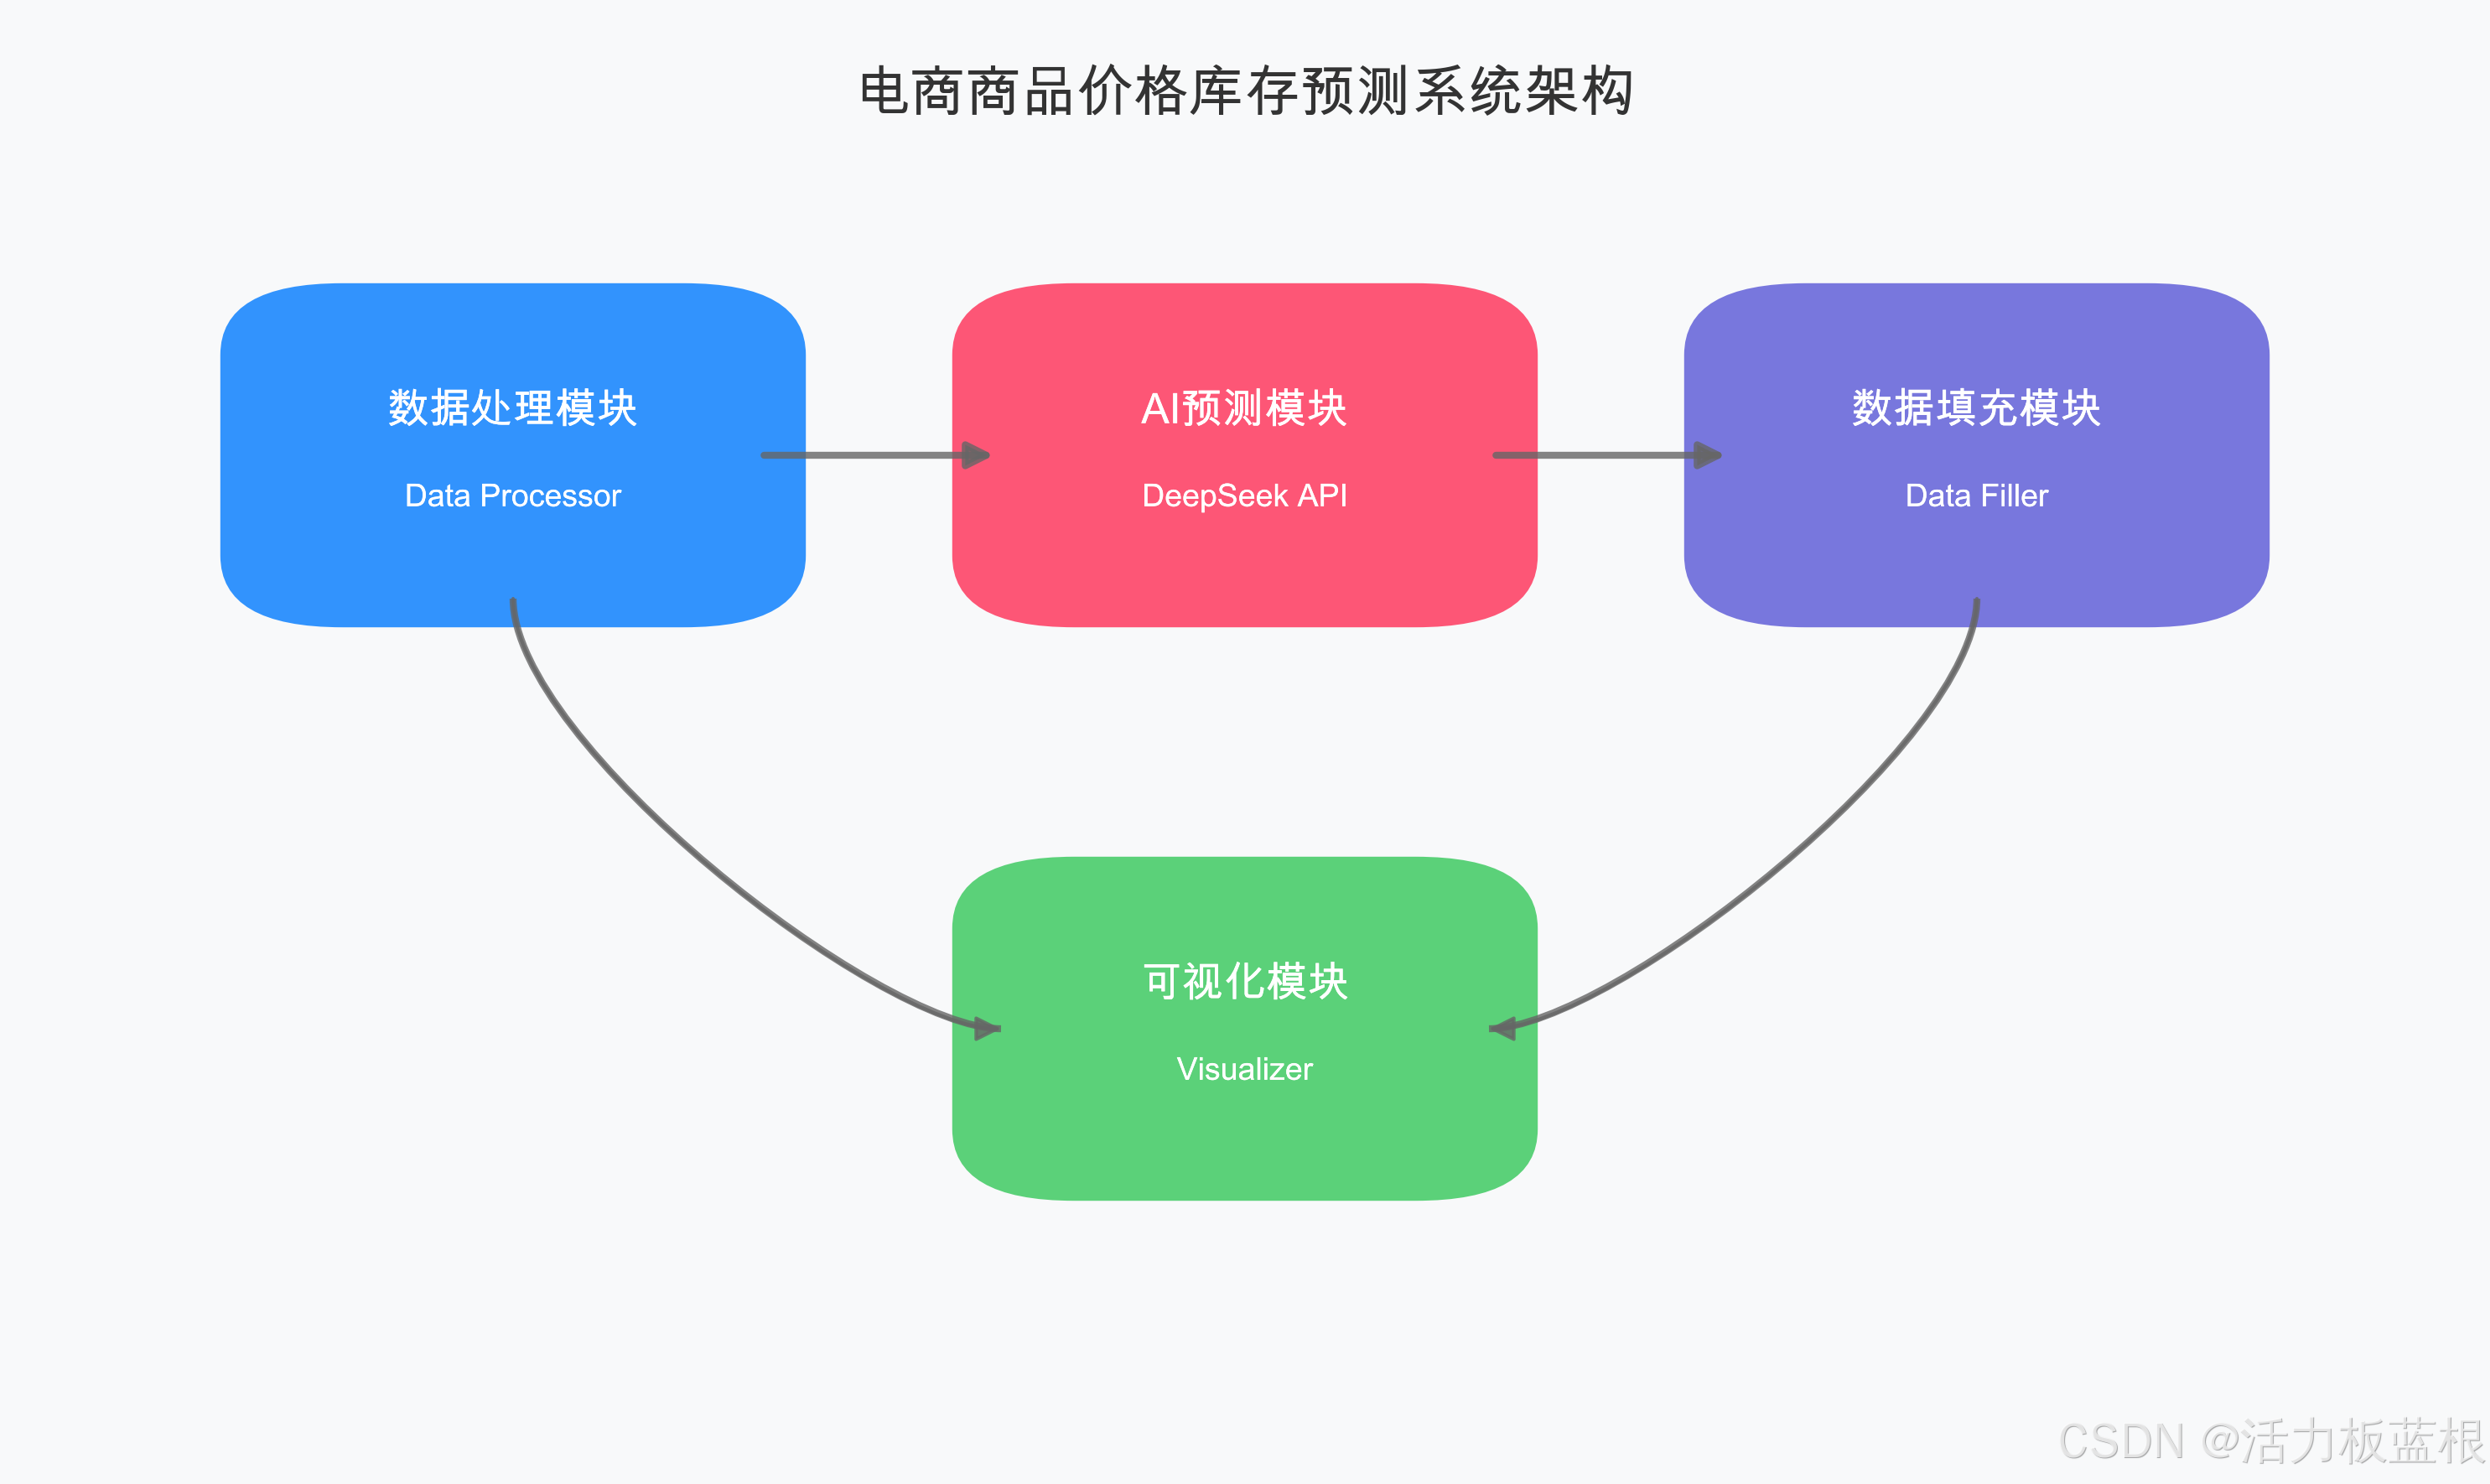
系统架构
系统采用模块化设计,主要包含以下功能模块:
-
数据处理模块
- 处理历史商品价格和库存数据
- 支持多种数据格式导入
- 自动数据清洗和标准化
-
AI预测模块(优化升级部分)
- 集成DeepSeek AI模型
- 预测未来6个月趋势
- 提供价格和库存范围预测
- 包含预测原因分析
-
数据填充模块(优化升级部分)
- 基于月度预测生成每日数据
- 支持多种填充算法
- 保证数据连续性和合理性
-
可视化模块
- 生成交互式HTML报告
- 展示历史数据和预测趋势
- 支持数据下钻分析
项目实现
1. 数据处理模块
数据处理模块负责解析和标准化原始数据。以下是核心实现:
class DataProcessor:
    def __init__(self, input_file, end_date=None):
        """
        初始化数据处理器

        参数:
            input_file (str): 输入CSV文件路径
            end_date (str, optional): 数据结束日期,格式'YYYY-MM-DD'
        """
        self.input_file = input_file
        self.end_date = datetime.strptime(end_date, '%Y-%m-%d') if end_date else datetime.now()
        self.start_date = self.end_date - timedelta(days=365)  # 处理近一年数据

        # 生成周数据时间点
        self.weekly_dates = [
            self.end_date - timedelta(days=i*7)
            for i in range(52)
        ]
        self.weekly_dates.reverse()  # 按时间顺序排列

        self.data = None
        self.processed_data = {

   }

    def _parse_json_array(self, json_str):
        """
        解析JSON数组字符串

        参数:
            json_str (str): JSON格式的数组字符串

        返回:
            list: 解析后的数组
        """
        try:
            # 处理可能的转义字符和引号问题
            cleaned_str = json_str.replace("'", '"').replace('""', '"')
            return json.loads(cleaned_str)
        except Exception as e:
            logger.error(f"JSON解析错误: {

     str(e)}")
            return []

    def _normalize_price_data(self, price_data):
        """
        标准化价格数据

        参数:
            price_data (list): 原始价格数据列表

        返回:
            list: 标准化后的价格数据
        """
        normalized = []
        for price_range in price_data:
            try:
                min_price = float(price_range[0])
                max_price = float(price_range[1])
                avg_price = (min_price + max_price) / 2

                # 异常值检测
                if min_price < 0 or max_price < min_price:
                    raise ValueError("价格数据异常")

                normalized.append({


                    'min': min_price,
                    'max': max_price,
                    'avg': avg_price
                })
            except Exception as e:
                logger.warning(f"价格数据标准化失败: {

     str(e)}")
                normalized.append({

   'min': 0, 'max': 0, 'avg': 0})

        return normalized

    def _normalize_stock_data(self, stock_data):
        """
        标准化库存数据

        参数:
            stock_data (list): 原始库存数据列表

        返回:
            list: 标准化后的库存数据
        """
        normalized = []
        for stock_range in stock_data:
            try:
                min_stock = int(stock_range[0])
                max_stock = int(stock_range[1])
                avg_stock = (min_stock + max_stock) // 2

                # 异常值检测
                if min_stock < 0 or max_stock < min_stock:
                    raise ValueError("库存数据异常")

                normalized.append({


                    'min': min_stock,
                    'max': max_stock,
                    'avg': avg_stock
                })
            except Exception as e:
                logger.warning(f"库存数据标准化失败: {

     str(e)}")
                normalized.append({

   'min': 0, 'max': 0, 'avg': 0})

        return normalized

    def process_data(self):
        """处理商品历史数据"""
        if self.data is None:
            if not self.load_data():
                return False

        for _, row in self.data.iterrows():
            product_id = row['product_id']
            category = row['category']

            try:
                # 解析价格和库存数据
                week_price_data = self._parse_json_array(row['week_price'])
                week_stock_data = self._parse_json_array(row['week_stock'])

                # 数据标准化处理
                price_data = self._normalize_price_data(week_price_data)
                stock_data = self._normalize_stock_data(week_stock_data)

                # 存储处理后的数据
                self.processed_data[product_id] = {


                    'category': category,
                    'historical_data': {


                        'dates': [d.strftime('%Y-%m-%d') for d in self.weekly_dates],
                        'price': price_data,
                        'stock': stock_data
                    }
                }

            except Exception as e:
                logger
最低0.47元/天 解锁文章


 2万+
2万+

 被折叠的 条评论
为什么被折叠?
被折叠的 条评论
为什么被折叠?
 到【灌水乐园】发言


