


This is my dataframe:
{'Parameter': {0: 'A', 1: 'A', 2: 'A', 3: 'A', 4: 'A', 5: 'A', 6: 'A', 7: 'A'},
'Site': {0: 'S1',
1: 'S2',
2: 'S1',
3: 'S2',
4: 'S1',
5: 'S2',
6: 'S1',
7: 'S2'},
'Value': {0: 2.3399999999999999,
1: 2.6699999999999999,
2: 2.5600000000000001,
3: 2.8900000000000001,
4: 3.4500000000000002,
5: 4.4500000000000002,
6: 3.6699999999999999,
7: 4.5599999999999996}}
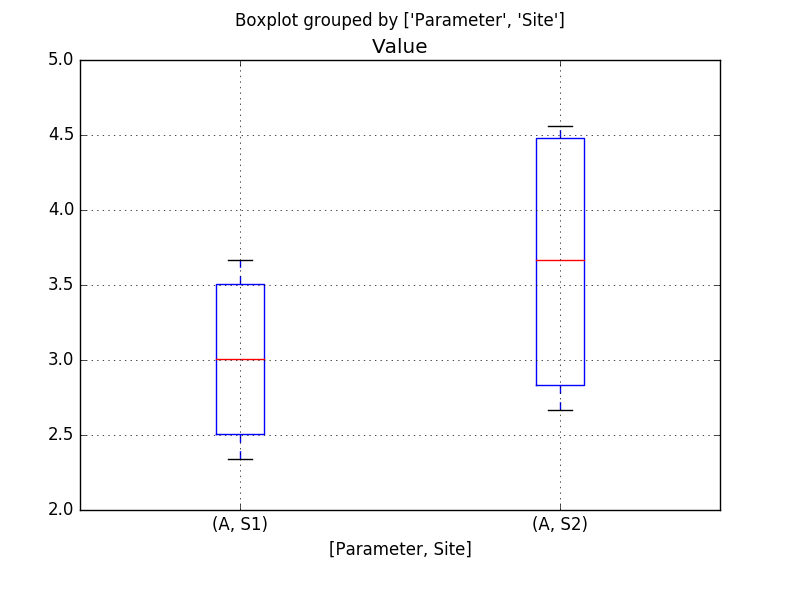
I am trying to plot boxplot of parameter by site. What is an easiest way to do it? Additional question is if i will have more than 1 parameter, what will be the easiest way to plot boxplot using matplotlib by parameter? Thank you
解决方案
You're going to want to use the DataFrame.boxplot method and group by the "Parameter" and "Site" columns.
import matplotlib.pyplot as plt
from pandas import DataFrame
df = DataFrame({'Parameter': ['A',]*8,
'Site': ['S1', 'S2', 'S1', 'S2', 'S1', 'S2', 'S1', 'S2'],
'Value': [2.34, 2.67, 2.56, 2.89, 3.45, 4.45, 3.67, 4.56]})
df.boxplot(by=['Parameter', 'Site'])
plt.show()
If you want to plot a specific column of your data, you can use the column keyword argument to boxplot.
# Plot single value
df.boxplot(column='Value', by=['Parameter', 'Site'])
# Plot Multiple values
df.boxplot(column=['Value', 'OtherValue'], by=['Parameter', 'Site'])


 1万+
1万+

 被折叠的 条评论
为什么被折叠?
被折叠的 条评论
为什么被折叠?
 到【灌水乐园】发言


