


愿你出走半生,归来仍是少年!
环境:Android Studio
在android上进行统计数据、列表、表格数据等信息展示是常有的需求。
在Github上有一个优秀的控件:smartTable
1.功能介绍
- 快速配置自动生成表格;
- 自动计算表格宽高;
- 表格列标题组合;
- 表格固定左序列、顶部序列、第一行、列标题、统计行;
- 自动统计,排序(自定义统计规则);
- 表格图文、序列号、列标题格式化;
- 表格各组成背景、文字、网格、padding等配置;
- 表格批注;
- 表格内容、列标题点击事件;
- 缩放模式和滚动模式;
- 注解模式;
- 内容多行显示;
- 分页模式;
- 首尾动态添加数据;
- 丰富的格式化;
- 支持二维数组展示(用于类似日程表,电影选票等);
- 导入excel(支持颜色,字体,背景,批注,对齐,图片等基本Excel属性);
- 表格合并单元(支持注解合并,支持自动合并);
- 支持其他刷新框架SmartRefreshLayout;
- 可配置表格最小宽度(小于该宽度自动适配);
- 支持直接List或数组字段转列;
- 支持Json数据直接转换成表格;
- 支持表格网格指定行列显示;
- 支持自动生成表单。
2.如何引入
allprojects {
repositories {
...
maven { url 'https://www.jitpack.io' }
}
}
dependencies {
compile 'com.github.huangyanbin:SmartTable:2.2.0'
}
3.使用
3.1.布局
在布局文件中直接插入控件,如下:
      <com.bin.david.form.core.SmartTable
            android:id="@+id/tb"
            android:layout_width="match_parent"
            android:layout_height="match_parent"
            app:layout_constraintBottom_toBottomOf="parent"
            android:layout_marginTop="@dimen/popup_title_height"
            android:layout_marginBottom="@dimen/dp68"
            app:layout_constraintBottom_toTopOf="@+id/llytBtns"
            app:layout_constraintTop_toBottomOf="@+id/lytTitle"/>
在SmartTable中数据的构建分为两种,一种是通过注解模式直接构建,方便快捷;一种是通过自己代码构建,这中扩展性更强。
3.1.通过注解模式构建数据
注解模式是通过在需要生成表格的类增加注记,然后通过这个类的集合去填充表格的方式。
3.1.1.@SmartTable
@SmartTable是表格注解,用于添加到类上面。它包含了四个参数。
| 注解 | 作用 |
|---|---|
| name | 表格名 |
| count | 是否显示统计行 |
| pageSize | 页数量 |
| currentPage | 当前页 |
3.1.2.@SmartColumn
@SmartColumn是列注解,用于添加到类的属性上面。它包含了多个参数。
| 注解 | 作用 |
|---|---|
| name | 列标题 |
| id | 列排序位置(越小越在前面) |
| parent | 父列名称(不设置则没有父列) |
| align | 设置该列对齐方式,默认居中 |
| type | 设置是否查询下一级。有ColumnType.Own,ColumnType.Child,两个值可以设置,假设UserInfo 有个属性是Family family对象,你想解析faily对象的属性monther,father两个属性,则需要设置Child,并在monther,father下添加相对应的注解@SmartColumn,否则只解析到Family,默认是Own。 |
| autoMerge | 设置是否自动合并。假设你返回的数据格式化之后该列附近数据有相同,则会自动合并成一个单元格,默认不开启合并。 |
| maxMergeCount | 合并最大数量 |
| autoCount | 是否开启统计。 table 开启显示统计行,设置autoCount为true,则该列可以自动统计,默认为false。 |
| fixed | 是否固定该列。 fixed设置为true,该列滚动到最左边时,可以自动固定住。 |
3.1.3.示例
@SmartTable(count = true)
public class WorkloadStatisticItemDto {


    public LocalDateTime Date;

    public LocalDateTime getDate(){
        return Date;
    }

    @SmartColumn(name = "日期",id = 1 )
    public String DataStr;


    @SmartColumn(name = "数量(个)",id = 2,autoCount = true )
    public int PointCount=0;


    @SmartColumn(name = "长度(米)",id = 3,autoCount = true )
    public Double LineLength=0d;


}
上方是一个注解类,包含三列:日期、管点数(个)、管线长(米),然后通过如下的方式将这个注解类的集合赋予表格控件即可实现展示。
    List<WorkloadStatisticItemDto> dtos = items.values().stream()
                .sorted(Comparator.comparing(WorkloadStatisticItemDto::getDate))
                .collect(Collectors.toList());


   binding.tb.setData(dtos);
3.2.通过代码组装数据
代码组装数据的时候需要的创建两个类别的东西,一个就是数据Dto集合,也就是要展示的数据,另外一个就是表格的列集合。
3.2.1.列(Column)
通过查看源码,Column有多个构造函数,
    /**列构造方法
     * 用于构造组合列
     * @param columnName 列名
     * @param children 子列
     */
    public Column(String columnName, List<Column> children) {
        this.columnName = columnName;
        this.children = children;
        isParent = true;
    }
    /**列构造方法
     * 用于构造组合列
     * @param columnName 列名
     * @param children 子列
     */
    public Column(String columnName, Column... children) {
        this(columnName, Arrays.asList(children));
    }
    /**列构造方法
     * 用于构造子列
     * @param columnName 列名
     * @param fieldName 需要解析的反射字段
     */
    public Column(String columnName, String fieldName) {
        this(columnName, fieldName, null, null);
    }

    /**列构造方法
     * 用于构造子列
     * @param columnName 列名
     * @param fieldName 需要解析的反射字段
     * @param format 文字格式化
     */
    public Column(String columnName, String fieldName, IFormat<T> format) {
        this(columnName, fieldName, format, null);
    }
    /**列构造方法
     * 用于构造子列
     * @param columnName 列名
     * @param fieldName 需要解析的反射字段
     * @param drawFormat 绘制格式化
     */
    public Column(String columnName, String fieldName, IDrawFormat<T> drawFormat) {
        this(columnName, fieldName, null, drawFormat);
    }

    /**列构造方法
     * 用于构造子列
     * @param columnName 列名
     * @param fieldName 需要解析的反射字段
     * @param format 文字格式化
     * @param drawFormat 绘制格式化
     */
    public Column(String columnName, String fieldName, IFormat<T> format, IDrawFormat<T> drawFormat) {
        this.columnName = columnName;
        this.format = format;
        this.fieldName = fieldName;
        this.drawFormat =drawFormat;
        datas = new ArrayList<>();
    }
通过构造创建列,并设置其基础属性
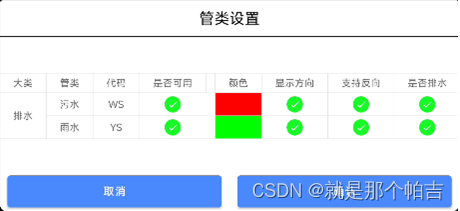
        Column<String> typeNameCol = new Column<>("大类", "TypeName");
        typeNameCol.setFixed(true);
        typeNameCol.setAutoMerge(true);

        Column<String> categoryCol = new Column<>("管类", "CategoryName");
        categoryCol.setFixed(true);


        Column<String> defaultColorCol = new Column<>("颜色", "DefailtColorStr");
3.2.2.表数据(TableData)
创建数据,绑定数据。
 var tbData = new TableData<>("管类", dtos, typeNameCol, categoryCol, codeCol, enableCol, nextSurveyIndexCol, defaultColorCol, showDirectionCol, canReverseCol,isDrainageCol);

   binding.tbCategorys.setTableData(tbData);
3.2.3.示例
4.总结
SmartTable的表格数据分为两种方式创建:注解、代码组装。
若是简单的需求,例如表格基础呈现这种需求,使用注解是代码量最少、最方便的方式。


 624
624

 被折叠的 条评论
为什么被折叠?
被折叠的 条评论
为什么被折叠?
 到【灌水乐园】发言


