


 本文介绍了iTOL,一个强大的在线系统发育树展示、注释和管理工具。通过详细步骤,展示了如何上传系统发育树文件,编辑树节点状态,以及如何利用不同模板添加注释信息,如标签内容、物种属性标记、颜色条带和热图等,以实现对进化树的美化和信息丰富化。
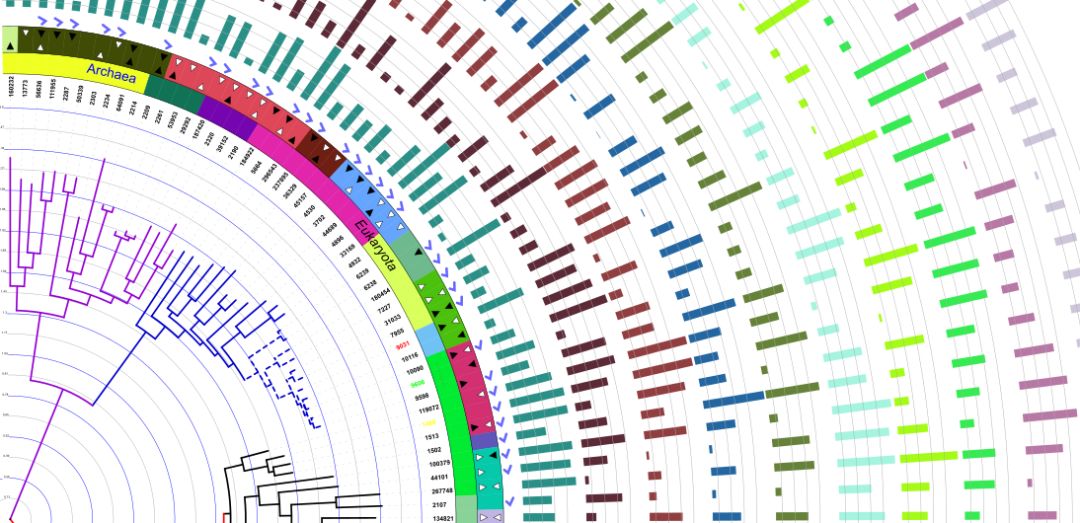
iTOL(https://itol.embl.de/)也即Interaction Tree Of Life,是一个集系统发育树在线展示、注释与管理为一体的交互工具。绘图过程中可以随意调整树枝、标签的颜色、形状和字体。iTOL最大的特点是可以同时展示不同的数据集,按照个性化的需求控制数据集的位置、大小和颜色,并允许导出高质量的位图和矢量图。
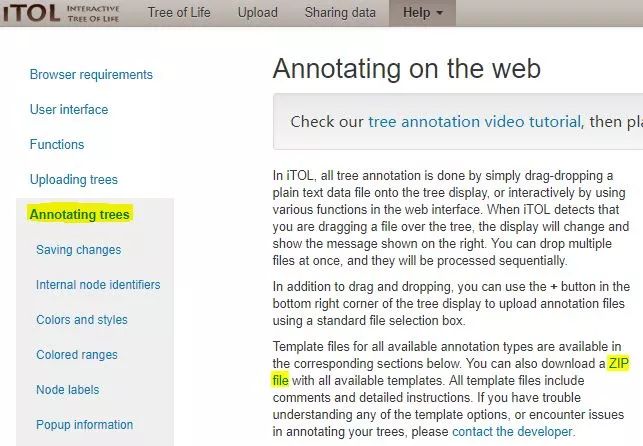
iTOL的输入文件主要包含两个部分:原始系统发育树文件(能识别Newick、Nexus、PhyloXML、Text和Jplace等格式)以及系统发育树注释文件。原始系统发育树文件根据DNA序列或者蛋白序列通过建树工具获得,注释文件模板可以从官网下载(https://itol.embl.de/help/templates.zip),如下所示:
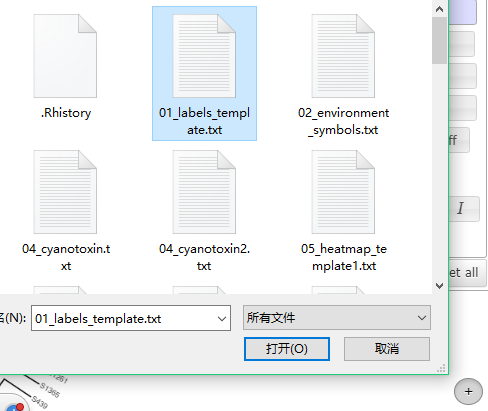
下载解压后内容如下所示:
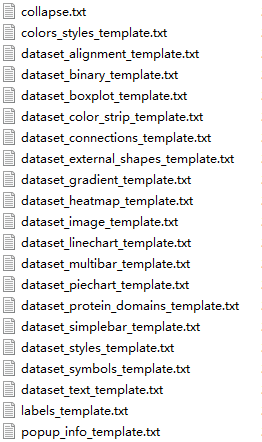
不同的模板用于不同的注释方式,适合不同的数据类型,根据模板名字我们大致可以看出其注释方式,例如箱线图(boxplot)、热图(heatmap)、饼形图(piechart)、物种分布特征图(binary)、堆叠柱状图(multibar)、颜色分类(color_strip)物种相关性(connections)等
接下来,我逐步介绍原始系统发育树文件的导入与美化,以及注释文件的编辑配置。首先,在iTOL主页上方点击Upload,点击“选择文件”按钮选择系统发育树文件,然后点击下方“Upload”按钮开始上传,Tree name填写或者不填都可以,如下所示:

数据上传后,网页会跳转至进化树绘制面板界面,如下所示:
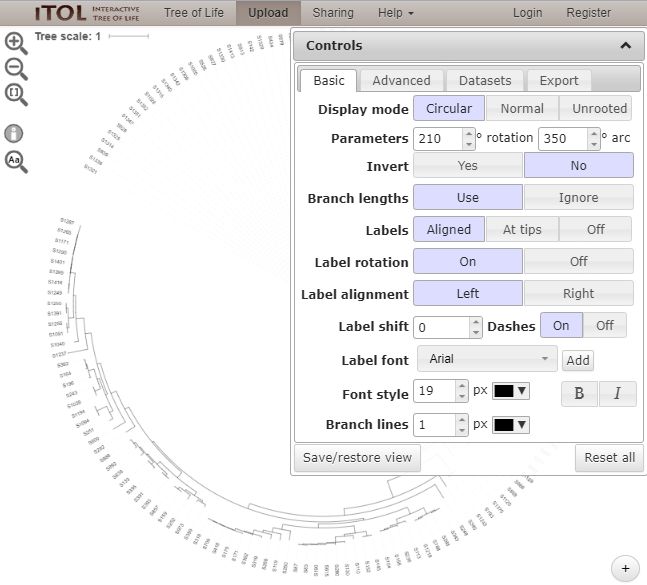
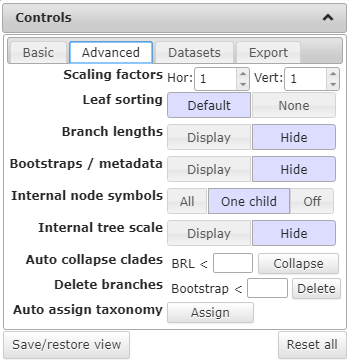
通过调整控制面板(Controls)中的参数可对进化树进行简单编辑,如调整树的性状(Display mode)、物种字体(Label font)、标签对齐(Label alignment)、标签旋转(Label rotation)、树枝粗细及颜色(Branch lines),甚至任意旋转进化树的方向(Parameters)等。Advanced栏下还有更多编辑条目,例如是否显示Bootstrap值等,如下所示:
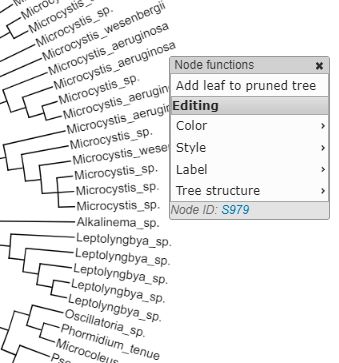
整棵树均为可编辑状态,用鼠标点击相应的节点或标签就可以出现编辑条目,如下所示:
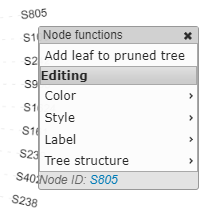
可编辑的内容包括颜色(包括节点颜色与分支颜色)、分支线条类型、标签内容及格式(默认标签内容为节点名称,节点名称也即建树时序列的名字)以及Tree structure,Tree structure包括重定根(根据outgroup物种或者参考文献确定root位置)、折叠分支(不重要的分支可以合并展示)。
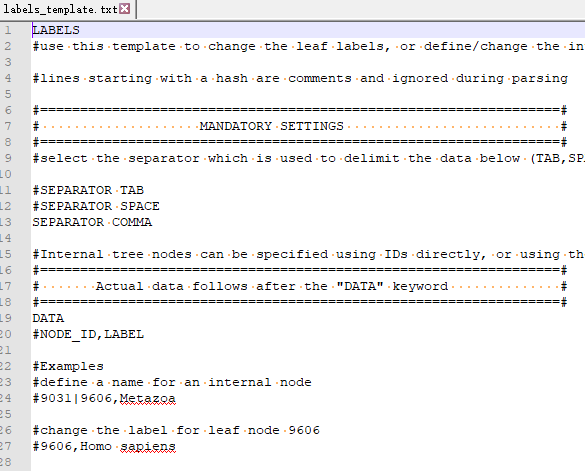
接下来我们着重阐述注释信息的添加。首先我们以修改标签内容的模板labels_template.txt为例,空白未修改的模板如下所示:
模板文件我们推荐使用软件Notepad++打开并编辑。
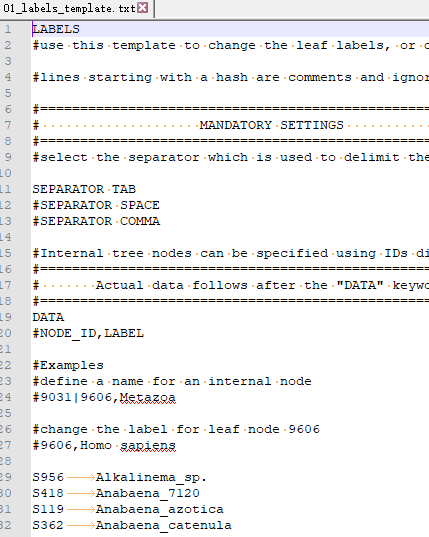
模板最前面写明了其用途(use this template to change the leaf labels),下面为模板的设置,每一个设置条目也都有详细的英文说明。强制设置的条目(MANDATORY SETTINGS)里面有分隔符的设置,可以选择制表符tab、空格、逗号,绝大多数情况下我们倾向于选择制表符,那样Excel中的数据可以直接复制粘贴到里面。你选择哪一种分隔符,就把该条目前面的“#”去掉,且保证另外两项前面都要有“#”。下面即为数据添加位置,模板中给出了示例,我们可以在Excel中编辑并直接粘贴到Notepad++中,编辑好之后如下所示:
现在返回浏览器的iTOL页面,在右下角有一个“+”按钮,点击就可以上传刚才编辑好的注释文档,如下所示:
树的修改效果如下所示:
可以看到标签内容已被修改,但是节点名字仍是不变的,接下来添加各种内容仍需基于原来的节点名字。接下来,我们可以添加物种的属性标记,使用dataset_symbols_template.txt模板,如下所示:
DATASET_SYMBOL#Symbol datasets allow the display of various symbols on the branches of the tree. For each node, one or more symbols can be defined.#Each symbol's color, size and position along the branch can be specified.#lines starting with a hash are comments and ignored during parsing#=================================================================## MANDATORY SETTINGS ##=================================================================##select the separator which is used to delimit the data below (TAB,SPACE or COMMA).This separator must be used throughout this file (except in the SEPARATOR line, which uses space).SEPARATOR TAB#SEPARATOR SPACE#SEPARATOR COMMA#label is used in the legend table (can be changed later)DATASET_LABEL Property#dataset color (can be changed later)COLOR #104E8B#=================================================================## OPTIONAL SETTINGS ##=================================================================##each dataset can have a legend, which is defined below#for each row in the legend, there should be one shape, color and label#shape should be a number between 1 and 6:#1: square#2: circle#3: star#4: right pointing triangle#5: left pointing triangle#6: checkmarkLEGEND_TITLE Sample propertyLEGEND_SHAPES 2 2 2LEGEND_COLORS #00B2EE #8B6914 #C4C4C4LEGEND_LABELS Freshwater Terrestrial Other#=================================================================## all other optional settings can be set or changed later ## in the web interface (under 'Datasets' tab) ##=================================================================##largest symbol will be displayed with this size, others will be proportionally smaller.MAXIMUM_SIZE 50#Internal tree nodes can be specified using IDs directly, or using the 'last common ancestor' method described in iTOL help pages#=================================================================## Actual data follows after the "DATA" keyword ##=================================================================##the following fields are required for each node:#ID,symbol,size,color,fill,position,label#symbol should be a number between 1 and 5:#1: rectangle#2: circle#3: star#4: right pointing triangle#5: left pointing triangle#6: checkmark#size can be any number. Maximum size in the dataset will be displayed using MAXIMUM_SIZE, while others will be proportionally smaller#color can be in hexadecimal, RGB or RGBA notation. If RGB or RGBA are used, dataset SEPARATOR cannot be comma.#fill can be 1 or 0. If set to 0, only the outline of the symbol will be displayed.#position is a number between 0 and 1 and defines the position of the symbol on the branch (for example, position 0 is exactly at the start of node branch, position 0.5 is in the middle, and position 1 is at the end)DATA#Examples#internal node will have a red filled circle in the middle of the branch#9606|184922,2,10,#ff0000,1,0.5#node 100379 will have a blue star outline at the start of the branch, half the size of the circle defined above (size is 5 compared to 10 above)#100379,3,5,#0000ff,0,0#node 100379 will also have a filled green rectangle in the middle of the branch, same size as the circle defined above (size is 10)#100379,1,10,#00ff00,1,0.5S1005 2 50 #00B2EE 1 1S1023 2 50 #00B2EE 1 1S1026 2 50 #00B2EE 1 1S1027 2 50 #00B2EE 1 1S1028 2 50 #00B2EE 1 1S1038 2 50 #00B2EE 1 1这个需要设置的就多了,包括符号位置、形状、颜色、大小等,上面都有详细解释,注释效果如下所示:
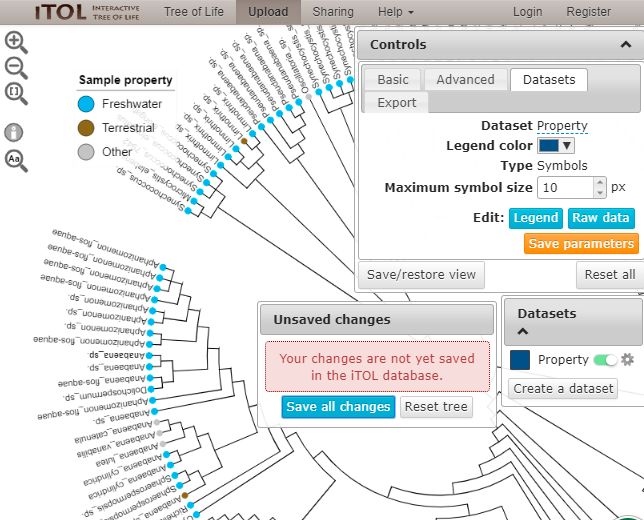
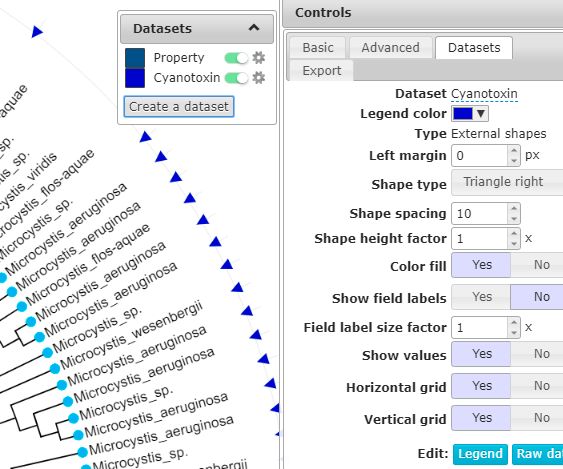
这时候在Controls框的Datasets中就可以看到刚刚上传的数据集,如果对刚才注释文件的设置不满意这时候也可以调整各种参数,同时还出现了一个Datasets框,用于显示已经上传的注释数据集,点击其右边的设置按钮就可以编辑改数据集信息。还可以使用dataset_external_shapes_template.txt添加外部符号,如下所示:
使用colors_styles_template.txt设置标签的背景颜色:
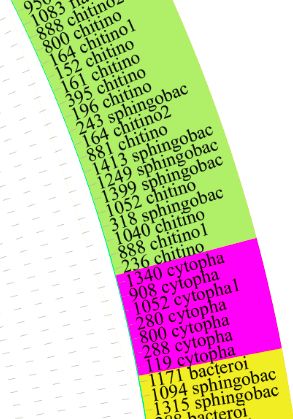
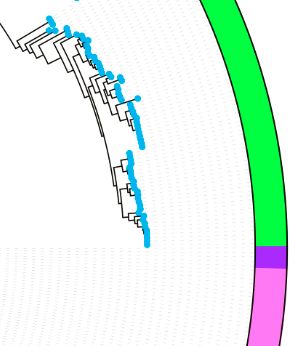
使用dataset_color_strip_template.txt添加彩色条带:
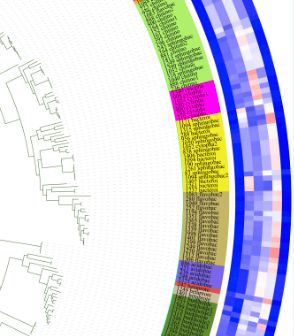
使用dataset_heatmap_template.txt添加热图:
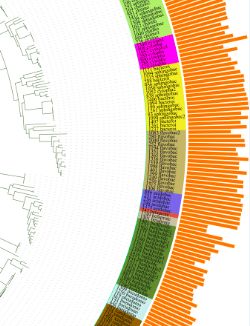
使用dataset_simplebar_template.txt添加条形图:
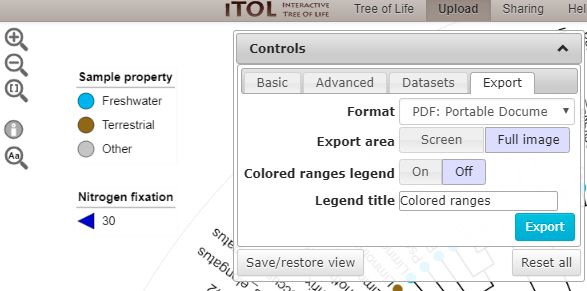
绘制完成后,在Controls框的Export栏下输出图像,推荐SVG和PDF两种格式,如下所示:


欢迎关注微生物生态与进化


 6513
6513

 被折叠的 条评论
为什么被折叠?
被折叠的 条评论
为什么被折叠?
 到【灌水乐园】发言


