


 本文通过实例演示了如何使用Python的Matplotlib库进行基本的数据可视化操作,包括绘制不同类型的图表、使用子图来组织多个图表以及调整图表的样式。
数据分析汇总学习
https://blog.youkuaiyun.com/weixin_39778570/article/details/81157884
# 导入库
import pandas as pd
import numpy as np
from pandas import Series, DataFrame
import matplotlib.pyplot as plt
# 等差数列50个值
x = np.linspace(0.0, 5.0)
# 生成两个y轴坐标
y1 = np.sin(np.pi*x)
y2 = np.sin(np.pi*x*2)
# 画线
plt.plot(x, y1, 'b--', label='sin(pi*x)')
plt.ylabel('y1 value')
plt.plot(x, y2, 'r--', label='sin(pi*2x)')
plt.ylabel('y2 value')
plt.xlabel('x value')
plt.title('this is x-y value')
# 显示线的label
plt.legend()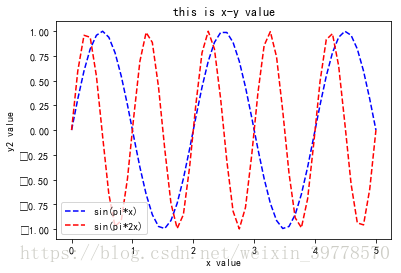
使用subplot画子图
# 两行一列的图,第三个参数为第几个图
plt.subplot(2,1,1)
# 画线
plt.plot(x, y1, 'b--')
plt.ylabel('y1')
# 切换到第二个子图
plt.subplot(2,1,2)
# 画线
plt.plot(x,y2,'r--')
plt.ylabel('y2')
plt.xlabel('x')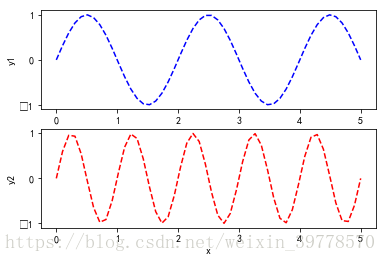
# 两行两列
plt.subplot(2,2,1)#也可以直接plt.subplot(221)
plt.plot(x, y1, 'b--')
plt.ylabel('y1')
plt.subplot(2,2,2)
plt.plot(x,y2,'r--')
plt.ylabel('y2')
plt.xlabel('x')
plt.subplot(2,2,3)
plt.plot(x, y1, 'b*')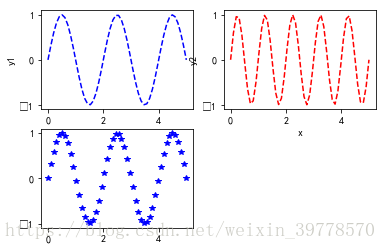
subplots
a = plt.subplots()
type(a)
tuple
a[0],a[1]
(<matplotlib.figure.Figure at 0x1f871bd0e10>,
 <matplotlib.axes._subplots.AxesSubplot at 0x1f871c31240>)
figure, ax = plt.subplots(2,2)
figure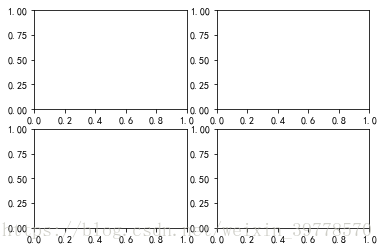
# ax是一个数组,可以通过ax访问子图
ax
array([[<matplotlib.axes._subplots.AxesSubplot object at 0x000001F871F49358>,
        <matplotlib.axes._subplots.AxesSubplot object at 0x000001F871F7DEF0>],
       [<matplotlib.axes._subplots.AxesSubplot object at 0x000001F871FB7EF0>,
<matplotlib.axes._subplots.AxesSubplot object at 0x000001F871FEEF60>]], dtype=object)ax[0][0].plot(x, y1)
ax[0][1].plot(x, y2)
figure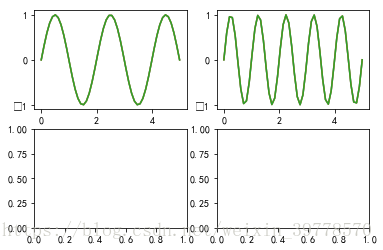


 859
859

 被折叠的 条评论
为什么被折叠?
被折叠的 条评论
为什么被折叠?
 到【灌水乐园】发言


