


Plotting
在Matplotlib中最重要的功能是绘图,可以绘制二维数据。
import numpy as np
import matplotlib.pyplot as plt
import matplotlib.pyplot as plt
x = np.arange(0, 3 * np.pi, 0.1)
y = np.sin(x) #y=x的正弦曲线
y = np.sin(x) #y=x的正弦曲线
plt.plot(x, y)
plt.show() # 绘图显示
plt.show() # 绘图显示
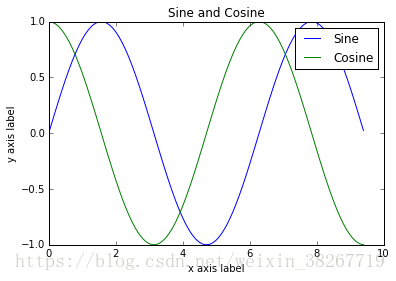
给图表添加标题、图例和轴标签
import numpy as np
import matplotlib.pyplot as plt
import matplotlib.pyplot as plt
x = np.arange(0, 3 * np.pi, 0.1)
y_sin = np.sin(x)
y_cos = np.cos(x)
y_sin = np.sin(x)
y_cos = np.cos(x)
# Plot the points using matplotlib
plt.plot(x, y_sin)
plt.plot(x, y_cos)
plt.xlabel('x axis label')
plt.ylabel('y axis label')
plt.title('Sine and Cosine')
plt.legend(['Sine', 'Cosine'])
plt.show()
plt.plot(x, y_sin)
plt.plot(x, y_cos)
plt.xlabel('x axis label')
plt.ylabel('y axis label')
plt.title('Sine and Cosine')
plt.legend(['Sine', 'Cosine'])
plt.show()
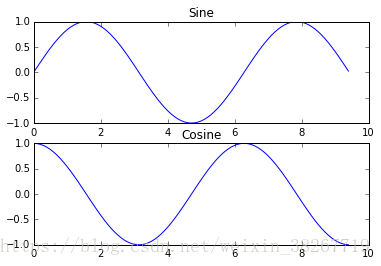
Subplots
import numpy as np
import matplotlib.pyplot as plt
import matplotlib.pyplot as plt
x = np.arange(0, 3 * np.pi, 0.1)
y_sin = np.sin(x)
y_cos = np.cos(x)
y_sin = np.sin(x)
y_cos = np.cos(x)
plt.subplot(2, 1, 1)
# 画第一张图,其实用法和matlab类似
plt.plot(x, y_sin)
plt.title('Sine')
plt.title('Sine')
plt.subplot(2, 1, 2)
# 画第二张图
plt.plot(x, y_cos)
plt.title('Cosine')
plt.plot(x, y_cos)
plt.title('Cosine')
plt.show()
Images
import numpy as np
from scipy.misc import imread, imresize
import matplotlib.pyplot as plt
from scipy.misc import imread, imresize
import matplotlib.pyplot as plt
img = imread('assets/cat.jpg')
img_tinted = img * [1, 0.95, 0.9]
img_tinted = img * [1, 0.95, 0.9]
plt.subplot(1, 2, 1)
# 画原图
plt.imshow(img)
plt.imshow(img)
plt.subplot(1, 2, 2)
# 画转换后图
plt.imshow(np.uint8(img_tinted))
#如果图片不是
uint8类型,在显示之前就将图像显式地映射到UIT8。
plt.show()
plt.show()


 4790
4790

 被折叠的 条评论
为什么被折叠?
被折叠的 条评论
为什么被折叠?
 到【灌水乐园】发言


