


 本文详细介绍了MATLAB中的一些图形标注与修饰函数,包括xlabel、ylabel、title、axis、grid、legend、fill、hold、text、gtext、semilogx、semilogy、loglog、polar、plotyy、bar、area、pie、errorbar和hist以及contour函数的使用方法和示例。

最近刚好在弄一些图,就想着把这些函数都整理一下。
包括,xlabel, ylabel, title, axis, grid, legend, fill, hold, text, gtext, semilogx, semology, loglog, polar, plotyy, bar, area, pie, errerbar, hist, contour,几个函数
(1)xlabel, ylabel, title
xlabel('string'):给当前x轴贴标签
ylabel('string'):给当前y轴贴标签
title('string'):给当前坐标轴上方正中央置放字符串string为标题
eg.
x=[2006:1:2015];
y=[1.45 0.91 2.3 0.86 1.46 0.95 1.0 0.96 1.21 0.75];
xin=2006:0.2:2015;
yin=spline(x,y,xin);
plot(x,y,'ob',xin,yin,'-.r')
title('降水量图')
xlabel('年份','FontSize',10)
ylabel('每年降雨量','FontSize',10)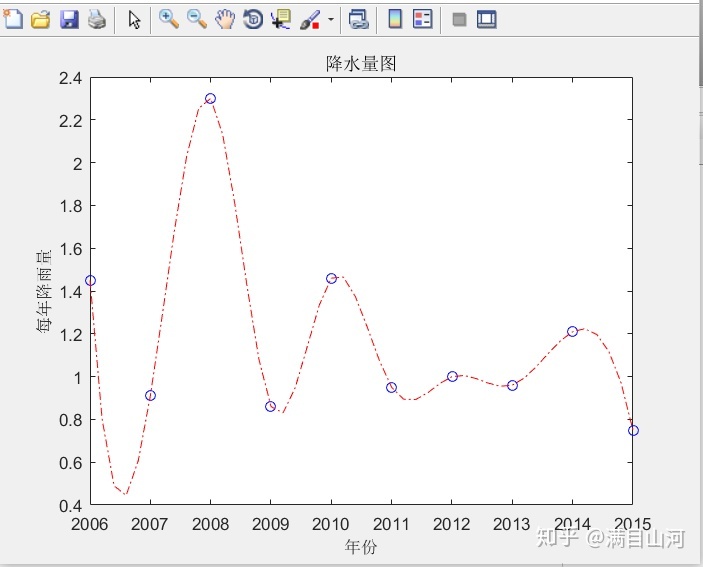
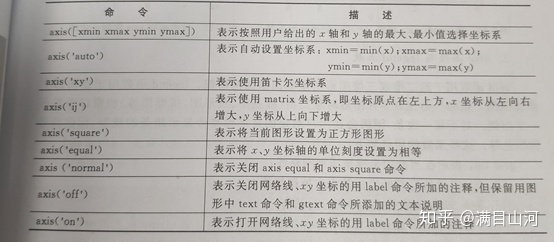
(2) axis
axis([xmin xmax ymin ymax]):限定x,y的范围
axis(str),str含义如下表所示
eg.
al=0:0.01:2*pi;
x=cos(al);
y=sin(al);
plot(x,y)
axis([-2 2 -2 2])
grid on
axis square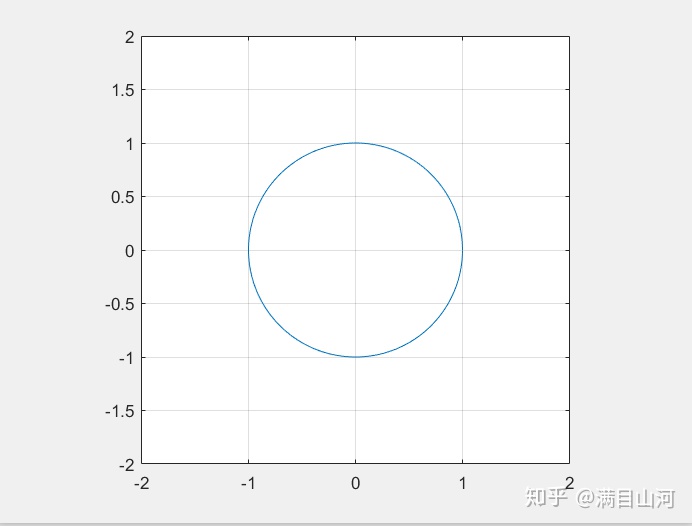
(3)grid, legend
grid on :添加网格线
grid off :去掉网格线
grid:转换分割线的显示与否的状态
legend('string','string',...,'string',pos):用指定string在当前坐标轴中对所给的数据的每一部分显示一个图例,在指定位置pos放置
legend('off'):清除图例
legend('hide'):隐藏图例
legend('show'):显示图例
eg.
x=-pi:0.01:pi;
y=sin(x);
plot(x,y)
title('正弦函数')
grid on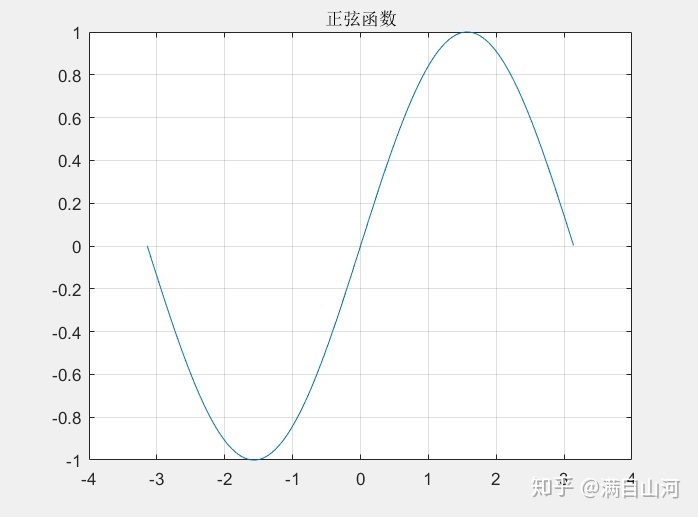
al=0:0.01:2*pi;
x=sin(al);
y=cos(al);
plot(x,y)
axis([-1.2 1.2 -1.2 1.2])
grid off
axis square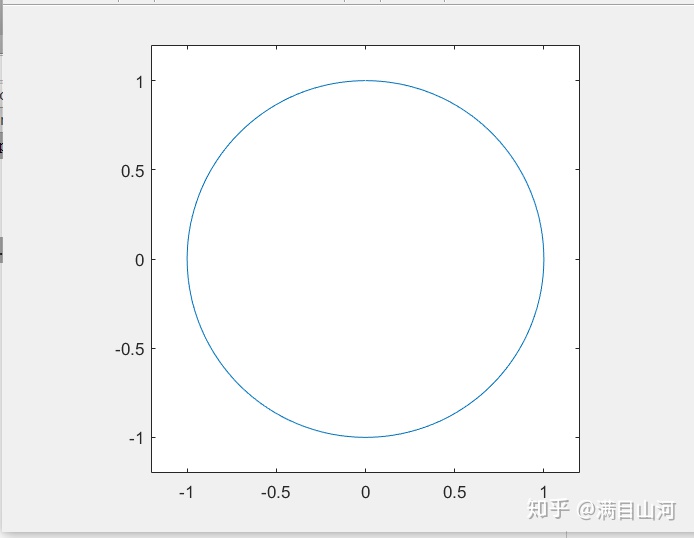
x=0:0.01*pi:4*pi;
y1=2*sin(x);
y2=log(x);
plot(x,[y1;y2])
axis([0 4*pi -2 2.5])
set(gca,'XTick',[0 pi 2*pi],'XTickLabel',{'0','pi','2pi'})
legend('2*sin(x)','log(x)')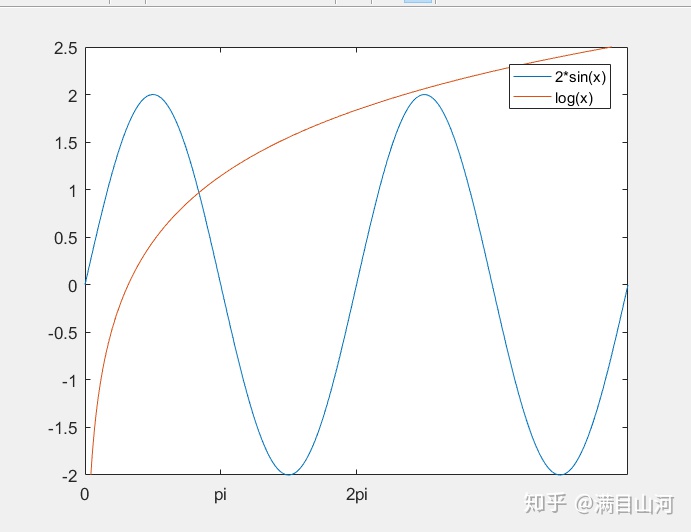
(4) fill, hold
fill 对一个封闭图形进行填充,hold函数用于对当前绘图叠加
fill(x,y,d):用d指定颜色来填充建立一个多边形,d为颜色映像索引向量或颜色字符
fill(x1,y1,c1,x2,y2,c2):一次定义多个要填充的二位区域
hold:可切换当前绘图的叠加模式
hold on,hold off :表示明确规定当前绘图窗口叠加绘图模式的开关状态
hold all:不仅实现hold on功能,使新的绘图依然循环初始设置的颜色循环序和线性循环序
eg.
t=(1/14:1/7:1)'*2*pi;
x=sin(t);
y=cos(t);
H=fill(x,y,'r');
axis square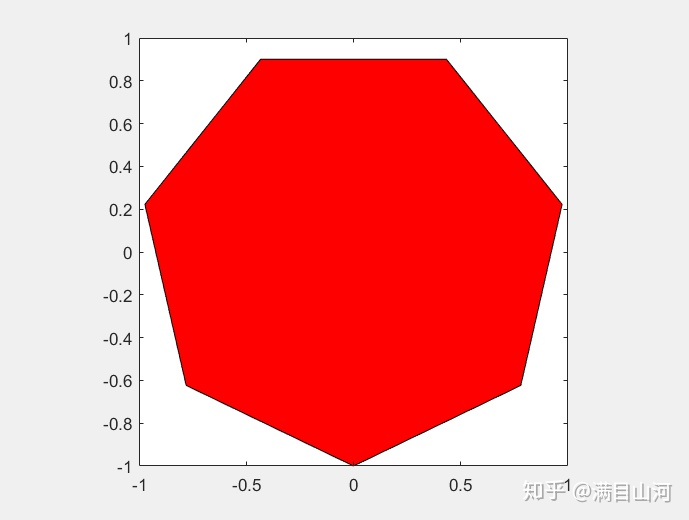
(5) text, gtext
text(x,y,'string'):在指定位置(x,y)显示字符串string
gtext('string'):当光标位于图形窗口内时,等待用户单击鼠标或按下键盘,光标的位置放置给定文字string
eg.
x=0:pi/100:6;
plot(x,sin(x));
text(3*pi/4,sin(3*pi/4),'leftarrowsin(x)=0.707','fontsize',14);
text(pi,sin(pi),'leftarrowsin(x)=0','fontsize',14);
text(5*pi/4,sin(5*pi/4),'sin(x)=-0.707rightarrow','horizontal','right','fontsize',14);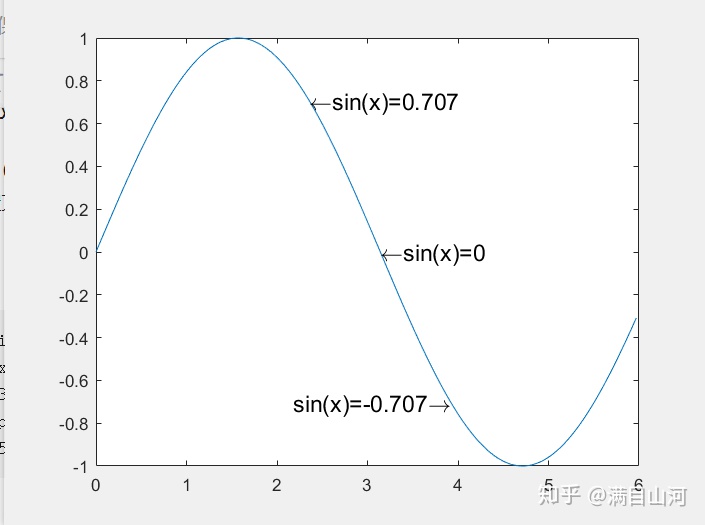
(6) semilogx
semilogx函数用于对x轴按对数比例绘制数据图
y=0:0.1:1;
semilogx(y,'+');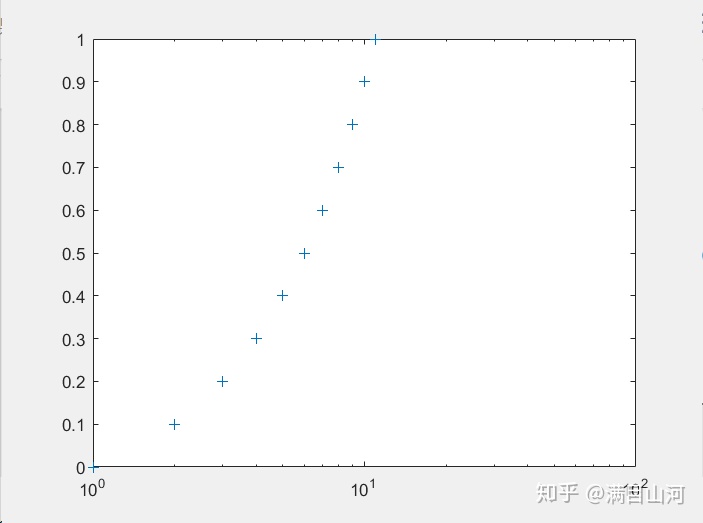
x=1:0.1*pi:2*pi;
y=sin(x);
semilogx(x,y,'*');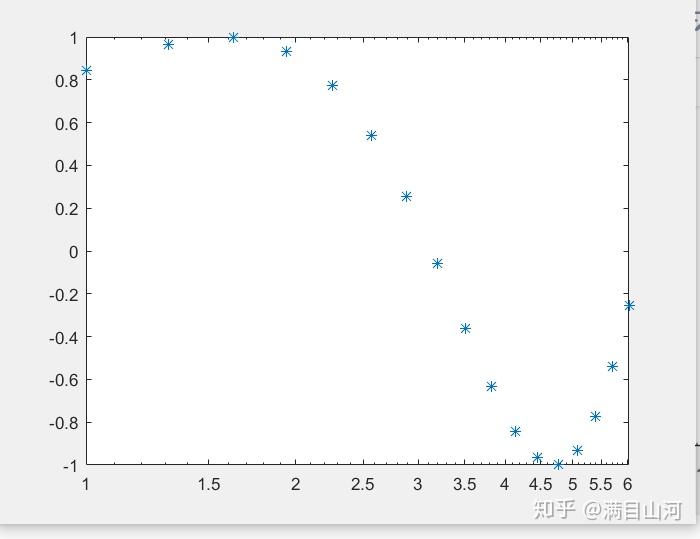
(7)semilogy
semilogy与semilogx相反,是y轴按对数比例绘制数据图
(8)loglog
loglog用于对x轴和y轴都按照对数比例绘制数据图
x=logspace(-3,3);
loglog(x,exp(x),'o');
grid on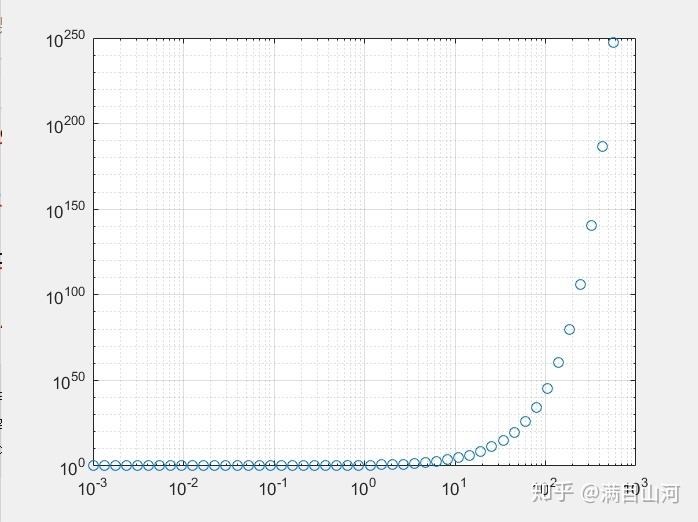
(9)polar
polar用于绘制极坐标下的二维图形
polar(theta,rho,s):其中theta为弧度表示的角度向量,rho是相应的幅向量,s为图形的属性设置选项
x=0:0.01*pi:4*pi;
y=sin(x/2)+x;
polar(x,y,'-');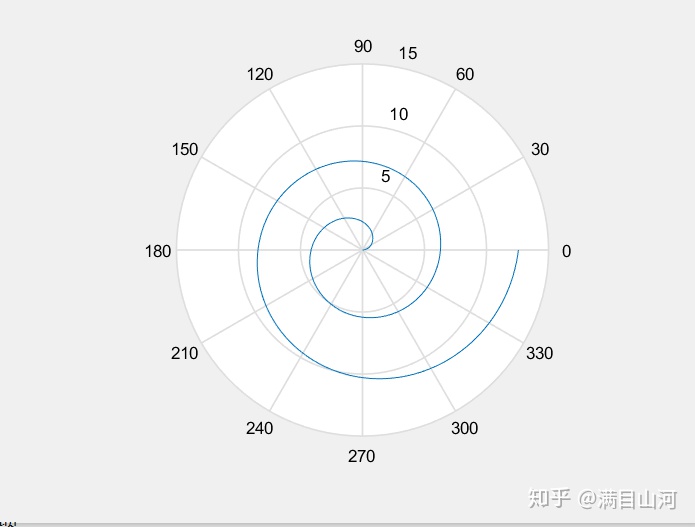
(10)plotyy
在进行数值比较过程中经常遇到双纵坐标显示的要求
plotyy(x1,y1,x2,y2,fun1,fun2):该命令以fun1的方式绘制(x1,y1),以fun2的的方式绘制(x2,y2)
t=0:pi/30:6;
y=exp(cos(t));
plotyy(t,y,t,y,'plot','stem')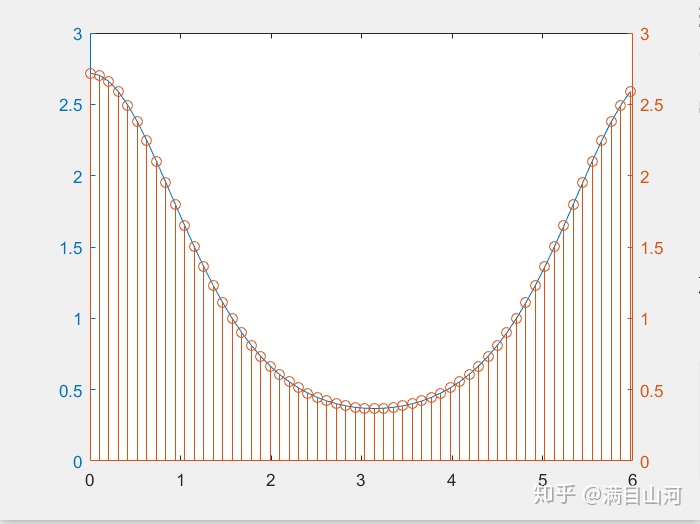
(11)bar
bar(x,y):在指定x的位置上绘制y中每一个元素的条形图
clear all
bar(rand(1,10))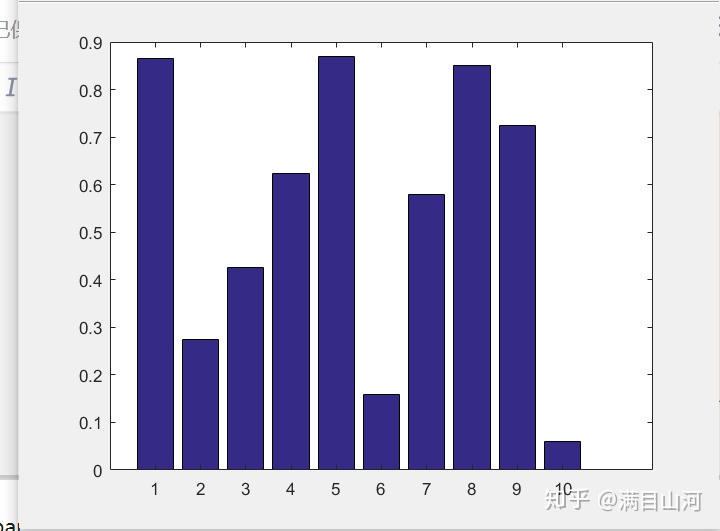
x=-2:0.1:2;
y=exp(-x.*x);
bar(x,y)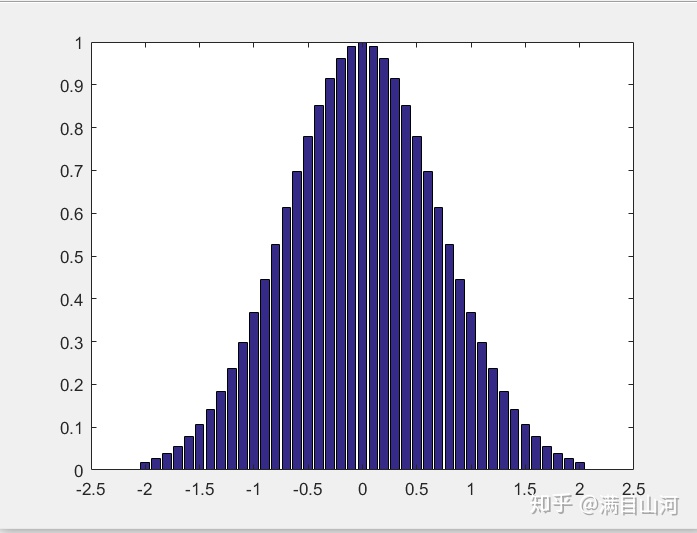
(12)area
area(x,y,ymin):绘制x对应点处y的数据的图。length(x)=length(y)或size(x)=size(y),x
单调,矩阵x的每一列单调
x=magic(6);
area(x)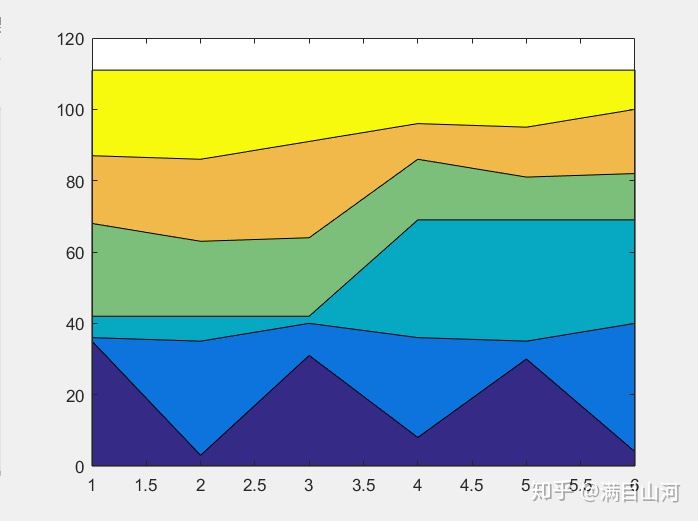
(13)pie
pie(x,explode):explode为与x对应的零或非零矩阵,非零值对应的扇区将从饼图中分离
x=[4 3 8 2 1 7 5];
explode=[0 0 0 0 1 1 0];
pie(x,explode)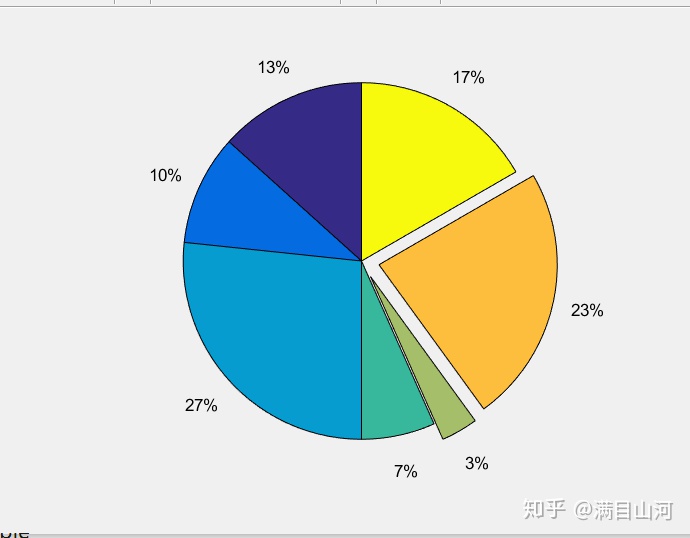
(14)errorbar
errorbar(Y,E):对Y绘图并在Y的每个元素处会一误差条,误差条两段距离曲线上下均为E(i)
errorbar(X,Y,E):绘X和Y的误差条图,误差条长度为2*E(i)
errorbar(X,Y,L,U):用由L(i)+U(i)指定了误差条上下长度来绘制误差条图
x=linspace(0,2*pi,30);
y=cos(x);
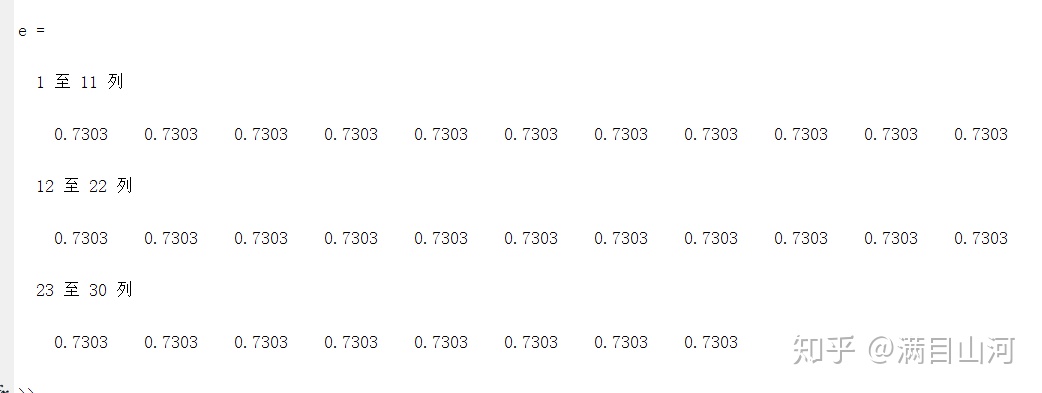
e=std(y)*ones(size(x))
errorbar(x,y,e)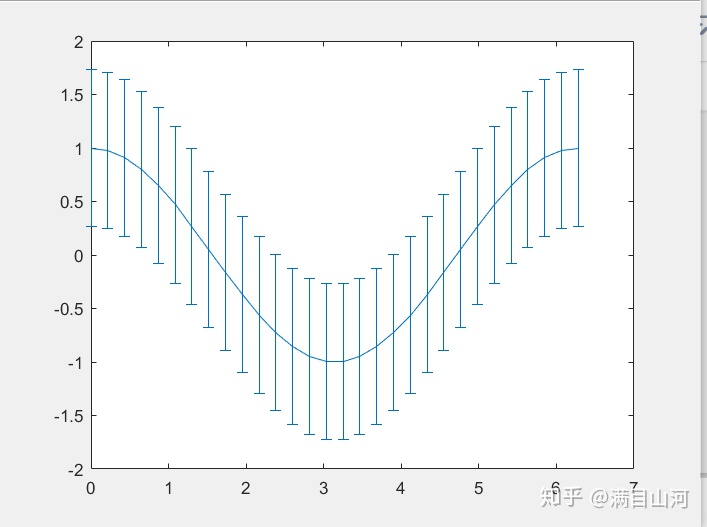
(15)hist
n=hist(Y):将Y中元素分到10个间隔相同的条形中,并返回每个条形中元素的个数
n=hist(Y,x):其中x是向量,返回Y的分布。若x为5元素向量,则hist将Y中的元素分配到五组条形中
n=hist(Y,nbins):nbins为标量,使用nbins组条形
x=-2.9:0.1:2.9;
y=randn(1000,1);
hist(y,x);
h=findobj(gca,'Type','patch');
set(h,'FaceColor','r','EdgeColor','w');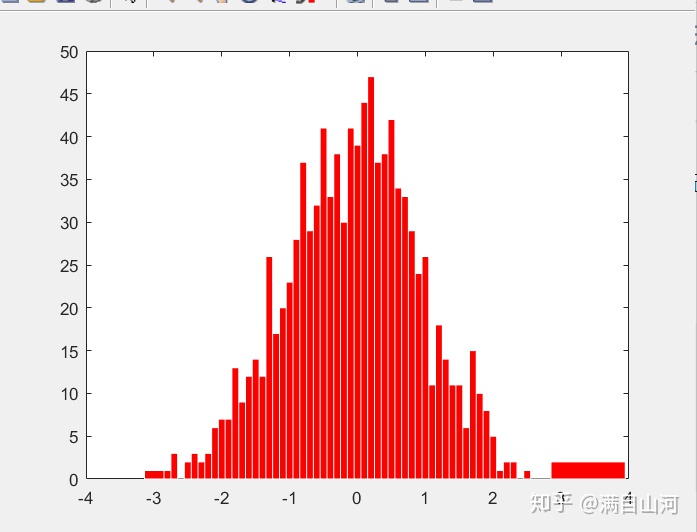
(16)contour
contour绘制等高线图
contour(Z,N/V)
contour(X,Y,Z,N/V)
[x,y]=meshgrid(-2:0.2:2,-2:0.2:3);
z=x.*exp(-x.^2-y.^2);
[c,h]=contour(x,y,z);
clabel(c,h);
colormap cool;
contour(x,y,z,20);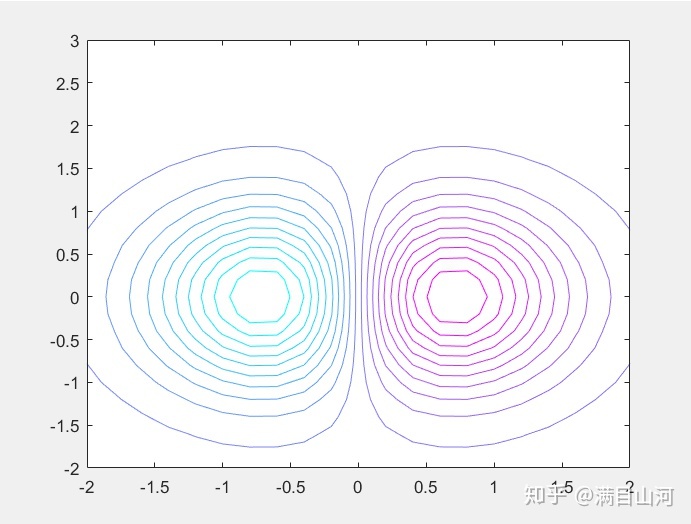


 8993
8993

 被折叠的 条评论
为什么被折叠?
被折叠的 条评论
为什么被折叠?
 到【灌水乐园】发言


