


 本文介绍了如何使用PyQt5开发桌面应用程序,特别是用于在图像上绘制网格的GUI。首先,概述了PyQt5的基础知识,包括常见小部件如QLabel和QLineEdit。接着,详细说明了开发过程,包括规划小部件布局、编写回调函数以实现交互式响应,以及自定义小部件,如限制输入范围的MyLineEdit和自定义QSlider。此外,还展示了如何将功能实现(如在图像上绘制网格)从无GUI版本转化为PyQt5版本。最后,提到了菜单栏和对话框在提高用户体验方面的价值。
pyqt5 gui
An effective PyQt5 workflow for developing a desktop application with the example GUI for drawing a grid in an image.
有效的PyQt5工作流程,用于使用示例GUI开发桌面应用程序以在图像中绘制网格。
Graphical user interfaces are usually covered in an IT project. For Python users, there are many famous frameworks for building GUIs, such as Tkinter, Kivy, WxPython, PyGUI. Last but not at least, PyQt/PySide, which combines the best of Python and Qt. PySide is very similar to PyQt. The two interfaces were comparable at first but PySide ultimately developed lagged behind PyQt. That’s why nowadays many developers have chosen PyQt, more specifically PyQt5(it’s the latest version). With PyQt5, we can create modern, portable, and stylish GUI’s for our Python programs.
图形用户界面通常包含在IT项目中。 对于Python用户,有许多用于构建GUI的著名框架,例如Tkinter,Kivy,WxPython,PyGUI 。 最后但并非至少如此, PyQt / PySide ,其中 结合了Python和Qt的优点。 PySide与PyQt非常相似。 最初这两个接口相当,但是PySide最终落后于PyQt。 这就是为什么如今许多开发人员选择PyQt,更具体地说是PyQt5(它是最新版本)的原因。 借助PyQt5,我们可以为Python程序创建现代,便携式和时尚的GUI。
There are many useful tutorial videos for PyQt5 online💻 (YouTube). However, in some time-critical projects, we must finish building an interface before watching through all related tutorial videos. What’s more, there are only special widgets needed in some use cases. Therefore, we recommend you first just to watch a few introduction videos and start to build an interface directly with a good strategy.
在线有很多有用的PyQt5教程视频💻(YouTube)。 但是,在一些时间紧迫的项目中,在观看所有相关的教程视频之前,我们必须完成界面的构建。 而且,在某些用例中仅需要特殊的小部件。 因此,我们建议您首先仅观看一些介绍视频,并开始以良好的策略直接构建界面。
起步 (Starting out)
Firstly, it’s important to take a brief glance at the official PyQt document at least, so that we have a basic understanding of common QWidgets: QLabel, QLineEdit, QPushButton, QCheckBox, QComboBox, QTextEdit, QMessageBox, QSlider, QInputDialog, QPregressBar, etc. If you have some experiences with HTML and CSS, these widgets are not difficult to understand. If not, it’s also not bad🙂 🙃 to learn them right now. We start our interface design by creating a window, where we can add widgets in demand.
首先,至少要简要浏览一下PyQt官方文档,这样才能使我们对常见的QWidgets有基本的了解:QLabel,QLineEdit,QPushButton,QCheckBox,QComboBox,QTextEdit,QMessageBox,QSlider,QInputDialog,QPregressBar等。如果您有使用HTML和CSS的经验,这些小部件并不难理解。 如果不是,那么立即学习它们也不错。 我们通过创建一个窗口开始我们的界面设计,我们可以在其中添加所需的小部件。
Next, we have to plan the position of each widget within the window, eg. where to place label_A, label_B…or some buttons. It depends on your layout design. In PyQt5, there is VBoxLayout, VBoxLayout, GridLayout, and StackedLayout typically.
接下来,我们必须计划窗口中每个小部件的位置,例如。 在何处放置label_A,label_B…或某些按钮。 这取决于您的布局设计。 在PyQt5中,通常有VBoxLayout,VBoxLayout,GridLayout和StackedLayout。
After setting the layout, our interface is visual and Intuitive. The third step is to write callback functions, which means the widgets will react based on users’ operations, either active or passive. An Interface is not only to be watched but operated, which is called interactive Response.
设置好布局后,我们的界面是直观直观的。 第三步是编写回调函数,这意味着小部件将根据用户的操作(主动或被动)做出React。 一个接口不仅要被观察而且要被操作,这被称为交互式响应。
In the end, we should clearly know how data/signal is transmitted in a GUI among widgets. Additionally, we should also know how data/signal flows from one window to another, since there is usually not only one window in a GUI.
最后,我们应该清楚地知道小部件之间如何在GUI中传输数据/信号。 另外,我们还应该知道数据/信号如何从一个窗口流到另一个窗口,因为GUI中通常不仅只有一个窗口。
自定义小部件 (Custom Widgets)
The standard widgets can’t always meet our satisfaction. Therewith, we should be able to define custom widgets, which inherit all the methods and properties from original widget classes. The newly defined widgets can be called up in GUI windows.
标准小部件不能总是满足我们的要求。 因此,我们应该能够定义自定义窗口小部件,这些窗口小部件继承了原始窗口小部件类的所有方法和属性。 可以在GUI窗口中调用新定义的小部件。
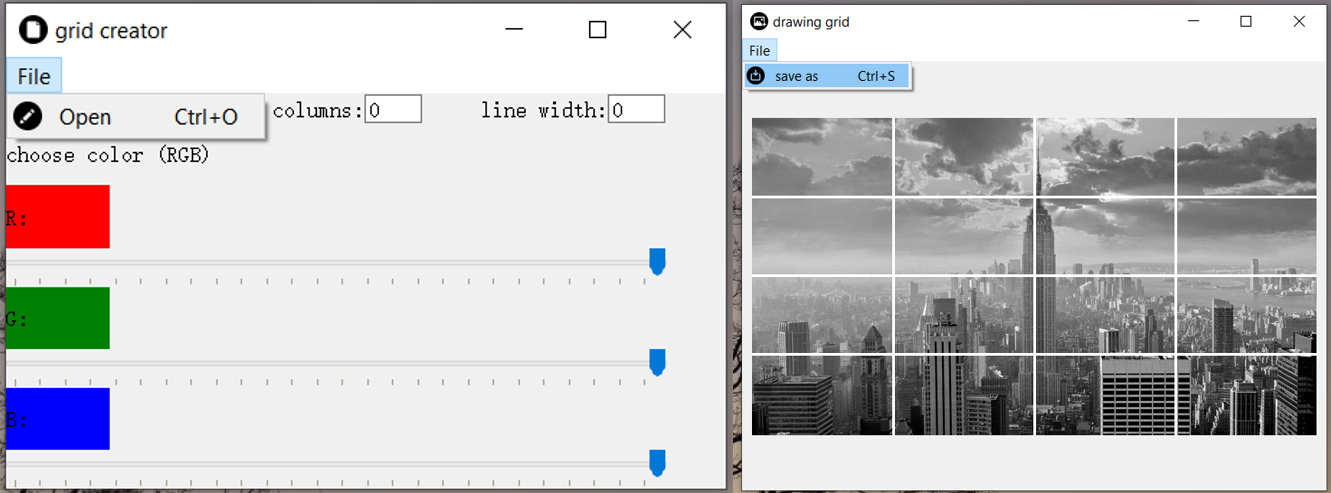
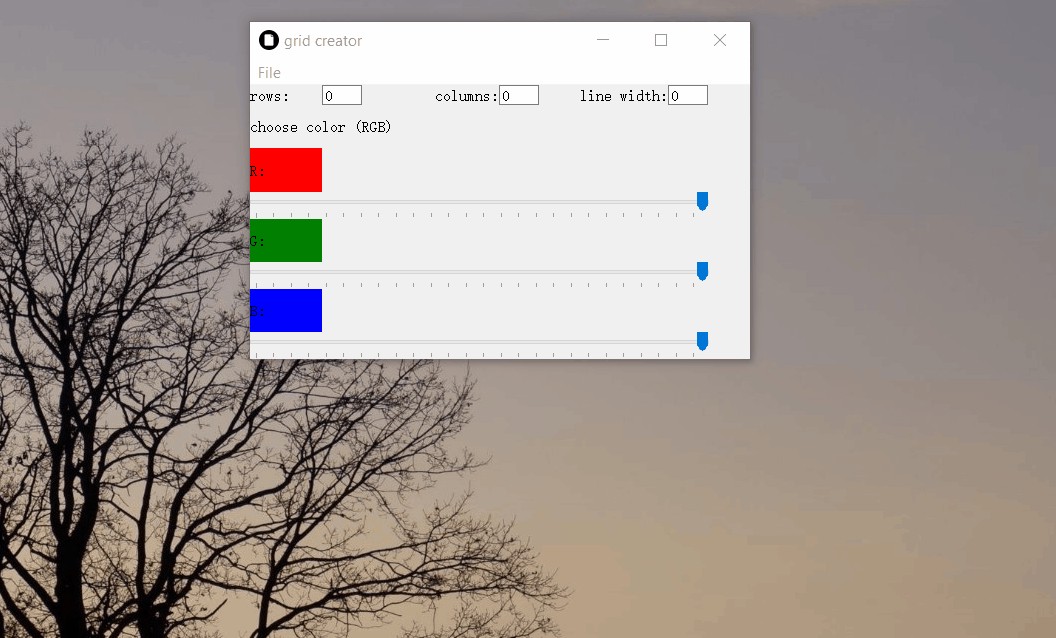
Here we give some custom widgets that we apply to our small GUI: grid creator, with which users can open an image from task folder and add a special grid (row number, column number, grid line thickness, grid line color can be decided by users) to the image and save the new image to a specified folder.
在这里,我们提供了一些适用于小型GUI的自定义小部件:网格创建器,用户可以使用它从任务文件夹中打开图像并添加特殊的网格(行号,列号,网格线粗细,网格线颜色可以由用户)到图像,然后将新图像保存到指定的文件夹。
class MyLineEdit(QLineEdit):
 def __init__(self, *args):
  QLineEdit.__init__(self, *args)
  self.setMaximumSize(40,20)
  self.setContentsMargins(0,0,0,0)
  self.setMaxLength(2)
  validator = QIntValidator(self)
  self.setValidator(validator)
 def event(self, event):
  if (event.type()==QtCore.QEvent.KeyPress) and (event.key()==Qt.Key_Up):
  if int(self.text())<99:
   self.setText(str(int(self.text())+1))

  if (event.type()==QtCore.QEvent.KeyPress) and (event.key()==Qt.Key_Down):
  if int(self.text())>0:
   self.setText(str(int(self.text())-1))
  return QLineEdit.event(self, event)
This part of code define our custom lineedit in which only int can be entered and the value is between 0–99, it can be manually entered and adjusted by up- and down key⬆️ ⬇️. The custom lineedit is used for setting the number of grid rows and columns.
这部分代码定义了我们的自定义lineedit,其中只能输入int,其值在0–99之间,可以通过上下键⬆️⬇️手动输入和调整。 自定义lineedit用于设置网格行和列的数量。
Another custom widget in our GUI is MySlider :
GUI中的另一个自定义小部件是MySlider:
class MySlider(QSlider):
 def __init__(self,*args):
  QSlider.__init__(self, *args)
  self.setMinimum(0)
  self.setMaximum(255)
  self.setValue(255)
  self.setTickPosition(QSlider.TicksBelow)
For custom QSlider we haven’t spent much time to decorate it. The important part is to set the value range, since each value from a RGB triple is between 0–255.
对于自定义QSlider,我们没有花太多时间来装饰它。 重要的部分是设置值范围,因为RGB三元组中的每个值都在0–255之间。
最有用的QLabel (The most useful QLabel)
Label is the essential element of the programming world, 3 previously posted blogs are all around the theme Machine Learning (Deep Learning), where data labeling is the process of detecting and tagging data samples in machine learning. If you are interested in my previous stories, the hyperlinks below.
标签是编程世界中必不可少的元素,之前发布的3个博客都围绕着机器学习(深度学习)主题,数据标记是在机器学习中检测和标记数据样本的过程。 如果您对我以前的故事感兴趣,请单击下面的超链接。
Here label is a widget, which acts as a placeholder to display non-editable text or image, or a movie of animated GIF. Without any exaggeration, Qlabel in PyQt5 is just like labeled data in Machine Learning. Although they play different roles, they are all used most often.
这里的标签是一个小部件,它充当占位符,以显示不可编辑的文本或图像或动画GIF影片。 毫不夸张地说,PyQt5中的Qlabel就像机器学习中的标签数据一样。 尽管它们扮演着不同的角色,但它们都是最常用的。
没有GUI的相同功能 (The same function without GUI)
if we want to write a GUI with specified framework, the first thing we need check is whether we are able to achieve the required function with simple code without the framework.
如果要编写具有指定框架的GUI,则需要检查的第一件事是,如果没有框架,我们是否能够用简单的代码实现所需的功能。
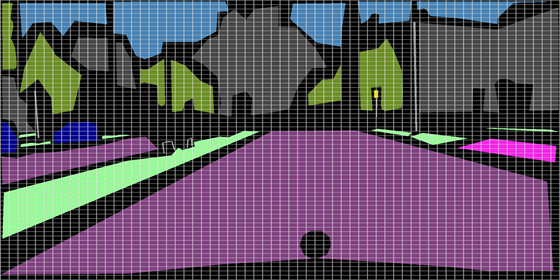
The objective: we read an image from a folder and add grid to it. It can be realized with OpenCV with a few line code with follows
目标:我们从文件夹中读取图像,并向其中添加网格。 可以使用OpenCV和以下几行代码来实现
img = cv2.imread(image_dir+’test.png’,1)
for i in range(1,column):
 img=cv2.line(img, (i*int(img.shape[1]/column), 0),(i*int(img.shape[1]/column), img.shape[0]), (255, 255, 255), line_thickness, 1)  for j in range(1,row):
   img=cv2.line(img, (0,j*int(img.shape[0]/row)),( img.shape[1],i*int(img.shape[0]/row)), (255, 255, 255), line_thickness, 1)cv2.imshow(‘cityscapes’,img)
cv2.imwrite(‘grid_pic.png’,img)
cv2.waitKey(0)
cv2.destroyAllWindows()
When row, column = 64, 64, we can plot a grid_picture looks like:
当row,column = 64,64时,我们可以绘制一个grid_picture,如下所示:
The same function part converted into PyQt5 looks like:
转换为PyQt5的相同功能部分如下所示:
self.label = QLabel()
img = cv2.imread(self.message)
img = np.asarray(img)
for i in range(1,self.column):
 img=cv2.line(img, (i*int(img.shape[1]/self.column), 0),(i*int(img.shape[1]/self.column), img.shape[0]), self.color, self.thick, 1)
  for j in range(1,self.row):
   img=cv2.line(img, (0,j*int(img.shape[0]/self.row)),( img.shape[1],j*int(img.shape[0]/self.row)), self.color, self.thick, 1)
self.output = img
image = QtGui.QImage(img.data, img.shape[1], img.shape[0], QtGui.QImage.Format_RGB888).rgbSwapped()
self.label.setPixmap(QtGui.QPixmap.fromImage(image))
Here we plot the grid added image in a label widget, which is very different from cv2.imshow.
在这里,我们在标签小部件中绘制添加网格的图像,这与cv2.imshow有很大不同。
菜单栏和对话框 (Menubar and Dialog)
Button to use is an effective way to submit users’ order, but not always. We suggest more frequently to take advantage of menubar, which looks compact and can be hided well when it’s temporally not used. When users have to open or save a file in the local folder, using Dialog is the most effortless way.
使用按钮是提交用户订单的有效方法,但并非总是如此。 我们建议更频繁地利用菜单栏,它看起来紧凑并且在暂时不使用时可以很好地隐藏。 当用户必须打开文件或将文件保存在本地文件夹中时,使用Dialog是最轻松的方法。
结论(Conclusion)
in this story, we try to share our experience in GUI programming with PyQt5. The workflow is introduced by explaining our grid creator GUI. The important operation steps and widgets during developing the GUI are pointed out. This approach is general applied to basic GUI development.
在这个故事中,我们尝试与PyQt5分享我们在GUI编程方面的经验。 通过解释我们的网格创建者GUI来介绍工作流程。 指出了开发GUI时的重要操作步骤和小部件。 此方法通常应用于基本的GUI开发。
翻译自: https://medium.com/swlh/pyqt5-for-building-a-gui-grid-creator-28f1bb5e90da
pyqt5 gui


 387
387

 被折叠的 条评论
为什么被折叠?
被折叠的 条评论
为什么被折叠?
 到【灌水乐园】发言


