


 本文介绍了如何使用ggalluvial包在R语言中绘制冲积图,通过vaccinations数据集展示基本绘图方法,并探讨如何处理多个类别变量、调整曲线形状、颜色以及图例等参数,以实现更精细的视觉效果。
Alluvial plot冲积图
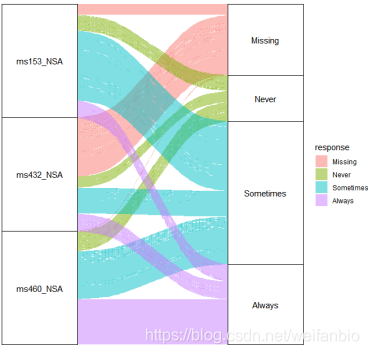
1.ggalluvial包绘制Alluvial plot,使用的数据集是R自带的vaccinations,简单绘图如下:
library(ggalluvial)

ggplot(data = vaccinations,
       aes(axis1 = survey, axis2 = response, y = freq)) +
  geom_alluvium(aes(fill = response)) +
  geom_stratum() +
  geom_text(stat = "stratum",
            aes(label = after_stat(stratum))) +
  scale_x_discrete(limits = c("Survey", "Response"),
                   expand = c(0.15, 0.05)) +
  theme_void()
2.如果数据集包含更多类别变量,可以将它们传递给aes(aex1,aex2,…等等)
library(ggalluvial)

ggplot(data = vaccinations,
       aes(axis1 = survey,   # First variable on the X-axis
           axis2 = response, # Second variable on the X-axis
           axis3 = survey,   # Third variable on the X-axis
           y = freq)) +
  geom_alluvium(aes(fill = response)) +
  geom_stratum() +
  geom_text(stat = "stratum",
            aes(label = after_stat(stratum)))
最低0.47元/天 解锁文章


 972
972


 到【灌水乐园】发言


