


 本文详细介绍如何使用TensorFlow构建复杂的数据流图,包括变量定义、数据流操作、变量更新及TensorBoard可视化。通过具体代码实例,展示了从图构建到会话运行的全过程。
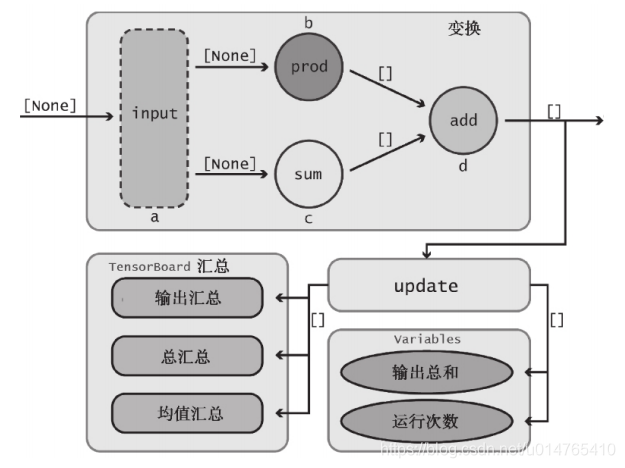
本文主要讲解如何利用Tensorflow实现如下的数据流图:
1)图中上半部分为要实现的数据流图;
2)图中左下角部分为要在TensorBoard中展现的变量值;
3)图中右下角部分为要更新的变量值;
以下为上述数据流图的实现code:
graph = tf.Graph() #定义一个数据流图
with graph.as_default(): #将graph作为默认的数据流图来使用
  #定义变量
  with tf.name_scope('variables'):#给变量一个作用域名称
    gobal_step = tf.Variable(0,dtype=tf.float32,trainable=False,name='global_step')
    total_output = tf.Variable(0,dtype=tf.float32,trainable=False,name='total_output')
  #定义数据流图
  with tf.name_scope('transformation'): #数据流图整体名称
    with tf.name_scope('input'): #input名称
      a = tf.placeholder(dtype=tf.float32,shape=[None],name='input_placeholder_a')
    with tf.name_scope('intermediate_layer'): #中间层
      b = tf.reduce_prod(a,name='product_b')
      c = tf.reduce_sum(a,name='sum_c')
    with tf.name_scope('output'): #输出层
      output = tf.add(b,c,name='output')
  #定义变量更新
  with tf.name_scope('update'):
    update_total = total_output.assign_add(output)
    increment_step = global_step.assign_add(1)
  #汇总Op
  with tf.name_scope('summaries'):
    avg = tf.div(update_total,tf.cast(increment_step,tf.float32),name='average')
    #为输出结点创建汇总数据
    tf.scalar_summary(b'Output',output,name='output_summary')
    tf.scalar_summary(b'Sum of Outputs over time',update_total,name='total_summary')
    tf.scalar_summary(b'Average of Outputs over time',avg,name='average_summary')
 #全局Variable对象和Op
  with tf.name_scope('global_ops'):
   init = tf.initialize_all_variables() #初始化全局变量global_step=0,total_output=0
   merger_summaries = tf.merge_all_summaries() #将所有汇总数据合并到一个Op

#定义好数据流图以后,创建会话
sess = tf.Session(graph=graph)
#开启SummaryWriter,保存汇总数据,以便在TensorBoard中展现
writer = tf.train.SummaryWriter('./imporved_graph',graph)
sess.run(init) #初始化随机变量

#构建函数,使得能够执行上述数据流图
def run_graph(input_tensor):
  _,summary,step = sess.run([output,merger_summaries,increment_step],feed_dict={a:input_tensor})
  writer.add_summary(summary,global_step=step) #保存汇总数据

#运行函数
run_graph([2,8])
run_graph([2,1,3,3])
run_graph([3,1,3,4,5])

#将汇总数据写入磁盘
writer.flush()

#关闭SummaryWriter对象(作用:将数据保存到特定目录)
writer.close()
#关闭会话
sess.close()


 被折叠的 条评论
为什么被折叠?
被折叠的 条评论
为什么被折叠?
 到【灌水乐园】发言


