


https://matplotlib.org/gallery/mplot3d/subplot3d.html?highlight=subplots
'''
====================
3D plots as subplots
====================
Demonstrate including 3D plots as subplots.
'''
import matplotlib.pyplot as plt
from matplotlib import cm
import numpy as np
from mpl_toolkits.mplot3d.axes3d import get_test_data
# This import registers the 3D projection, but is otherwise unused.
from mpl_toolkits.mplot3d import Axes3D # noqa: F401 unused import
# set up a figure twice as wide as it is tall
fig = plt.figure(figsize=plt.figaspect(0.5))
#===============
# First subplot
#===============
# set up the axes for the first plot
ax = fig.add_subplot(1, 2, 1, projection='3d')
# plot a 3D surface like in the example mplot3d/surface3d_demo
X = np.arange(-5, 5, 0.25)
Y = np.arange(-5, 5, 0.25)
X, Y = np.meshgrid(X, Y)
R = np.sqrt(X**2 + Y**2)
Z = np.sin(R)
surf = ax.plot_surface(X, Y, Z, rstride=1, cstride=1, cmap=cm.coolwarm,
linewidth=0, antialiased=False)
ax.set_zlim(-1.01, 1.01)
fig.colorbar(surf, shrink=0.5, aspect=10)
#===============
# Second subplot
#===============
# set up the axes for the second plot
ax = fig.add_subplot(1, 2, 2, projection='3d')
# plot a 3D wireframe like in the example mplot3d/wire3d_demo
X, Y, Z = get_test_data(0.05)
ax.plot_wireframe(X, Y, Z, rstride=10, cstride=10)
plt.show()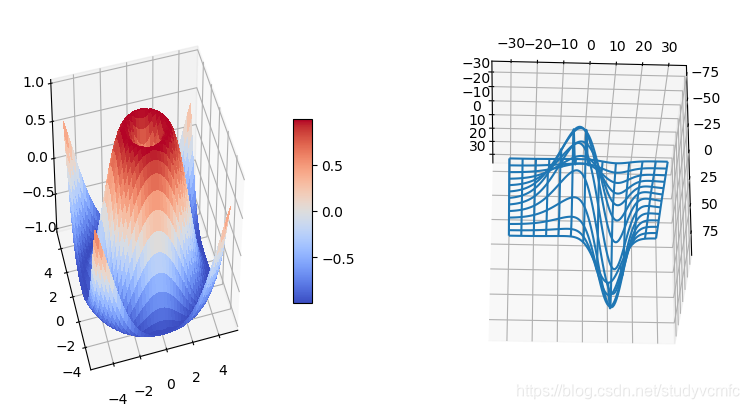


 515
515

 被折叠的 条评论
为什么被折叠?
被折叠的 条评论
为什么被折叠?
 到【灌水乐园】发言


