


【GPT入门】第71课 autogen介绍与代码实现股票分析汇报多智能体
AutoGen是微软公司发布的一个开源编程框架,旨在通过多智能体协作来构建基于大语言模型的下一代应用程序。以下是其详细介绍和特点:
1. autogen介绍
1.1 autogen介绍
AutoGen的核心在于支持多个Agent之间的互动合作,以解决复杂的任务。每个Agent都可以被定制,以扮演不同的角色,例如程序员、公司高管或设计师等。通过这种方式,AutoGen使得大模型能够模拟人类间的对话和协作,从而高效地处理工作流。
除了AutoGen框架本身,微软还推出了AutoGen Studio,这是一个更为直观的工具,它为用户提供了一个可视化界面,用以定义、修改智能体参数,与智能体交互,添加技能,并管理会话。AutoGen的应用场景非常广泛,包括自动化文档生成、多智能体协作的客户服务、数据分析和报告,以及个性化学习等。
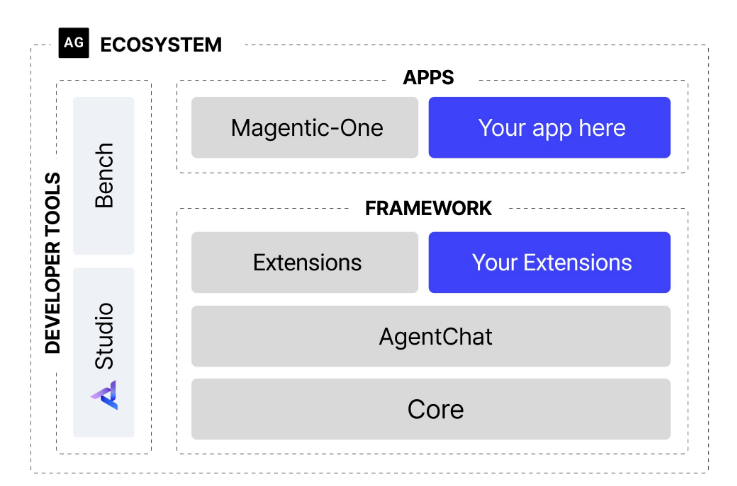
AUTOGEN 架构
1.2 特点
- 可定制的智能体:开发者可以定义不同角色和能力的智能体,如AssistantAgent、UserProxyAgent、TeachableAgent等,每个智能体都能根据需求被赋予特定的功能和行为模式。
- 多智能体协作:支持多种交互模式,如双人对话、顺序聊天、群聊等,群聊由管理者协调,能够模拟人类团队的协作方式,将复杂任务分解为多个子任务,由不同智能体分别处理,提高任务处理效率。
- 工具集成:智能体可以调用外部工具,如代码执行、API调用、数据库查询等,从而扩展了智能体的功能,使其能够更好地处理各种实际任务。
- 人类参与:支持“人在回路”,允许人类提供反馈或干预,使得系统在运行过程中能够结合人类的智慧和判断,提高结果的准确性和可靠性。
- 异步与可扩展架构:最新版本采用异步、事件驱动架构,支持分布式系统和跨语言开发,如Python和.NET,这使得AutoGen能够适应不同的开发环境和需求,具有良好的扩展性和性能表现。
- 低代码接口:通过AutoGen Studio提供无代码或低代码界面,降低了开发门槛,即使是非专业的开发者也能够轻松上手,快速构建基于智能体的应用程序。
2. 安装
参考官网:https://github.com/microsoft/autogen
官网建议python版本3.10及以上, 这里使用3.11,参考前面的文章安装conda环境
# Install AgentChat and OpenAI client from Extensions
pip install -U "autogen-agentchat" "autogen-ext[openai]"
# Install AutoGen Studio for no-code GUI
pip install -U "autogenstudio"
3. 股票分析的多agent代码实践
3.1 agent设计思路
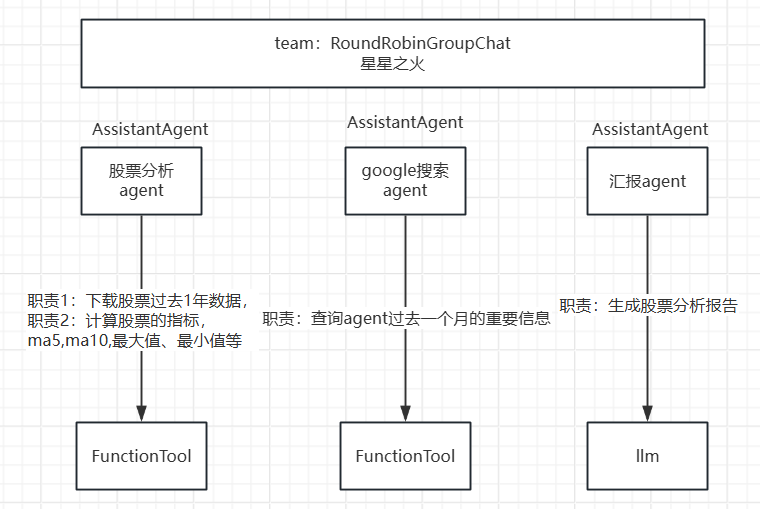
设计思路: 设计一个team: team由3个agent组成,分别是 股票分析agent、google搜索agent、股票分析汇报agent,执行顺序是依次。
3.2 代码实现
- 导包
from autogen_agentchat.agents import AssistantAgent
from autogen_agentchat.conditions import TextMentionTermination
from autogen_agentchat.teams import RoundRobinGroupChat
from autogen_agentchat.ui import Console
from autogen_core.tools import FunctionTool
from autogen_ext.models.openai import OpenAIChatCompletionClient
import os

os.environ["GOOGLE_API_KEY"] = "AIzaSyChLbcLjXwSSssuzXzjchqA5E_t4aEDWp4"
os.environ["GOOGLE_SEARCH_ENGINE_ID"] = "961e69d5fd62145b2"
- 编写function
#!pip install yfinance matplotlib pytz numpy pandas python-dotenv requests bs4


def google_search(query: str, num_results: int = 2, max_chars: int = 500) -> list:  # type: ignore[type-arg]
    import os
    import time

    import requests
    from bs4 import BeautifulSoup
    from dotenv import load_dotenv

    load_dotenv()

    api_key = os.getenv("GOOGLE_API_KEY")
    search_engine_id = os.getenv("GOOGLE_SEARCH_ENGINE_ID")

    if not api_key or not search_engine_id:
        raise ValueError("API key or Search Engine ID not found in environment variables")

    url = "https://customsearch.googleapis.com/customsearch/v1"
    params = {"key": str(api_key), "cx": str(search_engine_id), "q": str(query), "num": str(num_results)}

    response = requests.get(url, params=params)

    if response.status_code != 200:
        print(response.json())
        raise Exception(f"Error in API request: {response.status_code}")

    results = response.json().get("items", [])

    def get_page_content(url: str) -> str:
        try:
            response = requests.get(url, timeout=10)
            soup = BeautifulSoup(response.content, "html.parser")
            text = soup.get_text(separator=" ", strip=True)
            words = text.split()
            content = ""
            for word in words:
                if len(content) + len(word) + 1 > max_chars:
                    break
                content += " " + word
            return content.strip()
        except Exception as e:
            print(f"Error fetching {url}: {str(e)}")
            return ""

    enriched_results = []
    for item in results:
        body = get_page_content(item["link"])
        enriched_results.append(
            {"title": item["title"], "link": item["link"], "snippet": item["snippet"], "body": body}
        )
        time.sleep(1)  # Be respectful to the servers

    return enriched_results


def analyze_stock(ticker: str) -> dict:  # type: ignore[type-arg]
    import os
    from datetime import datetime, timedelta

    import matplotlib.pyplot as plt
    import numpy as np
    import pandas as pd
    import yfinance as yf
    from pytz import timezone  # type: ignore

    stock = yf.Ticker(ticker)

    # Get historical data (1 year of data to ensure we have enough for 200-day MA)
    end_date = datetime.now(timezone("UTC"))
    start_date = end_date - timedelta(days=365)
    hist = stock.history(start=start_date, end=end_date)

    # Ensure we have data
    if hist.empty:
        return {"error": "No historical data available for the specified ticker."}

    # Compute basic statistics and additional metrics
    current_price = stock.info.get("currentPrice", hist["Close"].iloc[-1])
    year_high = stock.info.get("fiftyTwoWeekHigh", hist["High"].max())
    year_low = stock.info.get("fiftyTwoWeekLow", hist["Low"].min())

    # Calculate 50-day and 200-day moving averages
    ma_50 = hist["Close"].rolling(window=50).mean().iloc[-1]
    ma_200 = hist["Close"].rolling(window=200).mean().iloc[-1]

    # Calculate YTD price change and percent change
    ytd_start = datetime(end_date.year, 1, 1, tzinfo=timezone("UTC"))
    ytd_data = hist.loc[ytd_start:]  # type: ignore[misc]
    if not ytd_data.empty:
        price_change = ytd_data["Close"].iloc[-1] - ytd_data["Close"].iloc[0]
        percent_change = (price_change / ytd_data["Close"].iloc[0]) * 100
    else:
        price_change = percent_change = np.nan

    # Determine trend
    if pd.notna(ma_50) and pd.notna(ma_200):
        if ma_50 > ma_200:
            trend = "Upward"
        elif ma_50 < ma_200:
            trend = "Downward"
        else:
            trend = "Neutral"
    else:
        trend = "Insufficient data for trend analysis"

    # Calculate volatility (standard deviation of daily returns)
    daily_returns = hist["Close"].pct_change().dropna()
    volatility = daily_returns.std() * np.sqrt(252)  # Annualized volatility

    # Create result dictionary
    result = {
        "ticker": ticker,
        "current_price": current_price,
        "52_week_high": year_high,
        "52_week_low": year_low,
        "50_day_ma": ma_50,
        "200_day_ma": ma_200,
        "ytd_price_change": price_change,
        "ytd_percent_change": percent_change,
        "trend": trend,
        "volatility": volatility,
    }

    # Convert numpy types to Python native types for better JSON serialization
    for key, value in result.items():
        if isinstance(value, np.generic):
            result[key] = value.item()

    # Generate plot
    plt.figure(figsize=(12, 6))
    plt.plot(hist.index, hist["Close"], label="Close Price")
    plt.plot(hist.index, hist["Close"].rolling(window=50).mean(), label="50-day MA")
    plt.plot(hist.index, hist["Close"].rolling(window=200).mean(), label="200-day MA")
    plt.title(f"{ticker} Stock Price (Past Year)")
    plt.xlabel("Date")
    plt.ylabel("Price ($)")
    plt.legend()
    plt.grid(True)

    # Save plot to file
    os.makedirs("coding", exist_ok=True)
    plot_file_path = f"coding/{ticker}_stockprice.png"
    plt.savefig(plot_file_path)
    print(f"Plot saved as {plot_file_path}")
    result["plot_file_path"] = plot_file_path

    return result
- 定义function tool
google_search_tool = FunctionTool(
    google_search, description="Search Google for information, returns results with a snippet and body content"
)
stock_analysis_tool = FunctionTool(analyze_stock, description="Analyze stock data and generate a plot")
- 定义client
from autogen_core.models import ModelFamily
model_client = OpenAIChatCompletionClient(model="deepseek-chat",
                                          base_url="https://api.deepseek.com/v1",
                                          api_key="sk-改为自己的key",
                                           model_info={
                                               "vision": False,
                                               "function_calling": True,
                                               "json_output": False,
                                               "family": ModelFamily.R1,
                                           },
                                         )
- 组建team
# model_client = OpenAIChatCompletionClient(model="gpt-4o")

search_agent = AssistantAgent(
    name="Google_Search_Agent",
    model_client=model_client,
    tools=[google_search_tool],
    description="Search Google for information, returns top 2 results with a snippet and body content",
    system_message="You are a helpful AI assistant. Solve tasks using your tools.",
)

stock_analysis_agent = AssistantAgent(
    name="Stock_Analysis_Agent",
    model_client=model_client,
    tools=[stock_analysis_tool],
    description="Analyze stock data and generate a plot",
    system_message="Perform data analysis.",
)

report_agent = AssistantAgent(
    name="Report_Agent",
    model_client=model_client,
    description="Generate a report based the search and results of stock analysis",
    system_message="You are a helpful assistant that can generate a comprehensive report on a given topic based on search and stock analysis. When you done with generating the report, reply with TERMINATE.",
)
team = RoundRobinGroupChat([stock_analysis_agent, search_agent, report_agent], max_turns=3)
- 启动agent
stream = team.run_stream(task="Write a financial report on American airlines")
await Console(stream)

await model_client.close()
4. autogen studio
可以使用可视化页面做上面代码的功能


 1431
1431

 被折叠的 条评论
为什么被折叠?
被折叠的 条评论
为什么被折叠?
 到【灌水乐园】发言


