


<div id="main" style="width:500px; height:500px"></div>

<script src="https://unpkg.com/echarts@5.5.0/dist/echarts.js"></script>
<script>
    // 初始化 ECharts 实例
    var myChart = echarts.init(document.getElementById('main'));

    var xData = ["2020-01", "2020-02", "2020-03", "2020-04", "2020-05", "2020-06"]
    var line = ["1030", "205", "84", "568", "689", "4587"];
    var attr = {
        'name': '月平均单价',
        'unit': '元/单'
    }
    // var graphicData = ["A级:1000-10000元/人",
    // "B级:10000-100000元/人",
    // "C级:100000-10000000元/人",
    // ];
    var colors = []
   var option = {

        tooltip: {
            trigger: 'item',
            padding: 1,
            formatter: function (param) {

                var resultTooltip =
                    "<div style='background:#fff;border:1px solid rgba(255,255,255,.2);padding:5px;border-radius:3px;'>" +
                    "<div style='text-align:center;'>" + param.name + "</div>" +
                    "<div style='padding-top:5px;'>" +
                    "<span style=''> " + attr.name + ": </span>" +
                    "<span style=''>" + param.value + "</span><span>" + attr.unit + "</span>" +
                    "</div>" +
                    "</div>";
                return resultTooltip
            }
        },
        grid: {
            left: '5%',
            top: '10%',
            right: '5%',
            bottom: '10%',
        },
        legend: {
            show: true,
            icon: 'circle',
            orient: 'horizontal',
            top: '90.5%',
            right: 'center',
            itemWidth: 16.5,
            itemHeight: 6,
            // itemGap: 30,
            textStyle: {
                // color: '#FFFFFF'
                color: '#C9C8CD',
                fontSize: 10
            }
        },
        dataZoom: {
            show: false, //为true滚动条出现
            type: 'slider', //type:'inside',滚动条在最下面,鼠标点击滚动
            startValue: 0, // 从头开始。
            endValue: 3, //end百分比显示范围,endValue具体显示几个数值
        },
        xAxis: [{
            data: xData,
            axisLabel: {
                textStyle: {
                    color: '#aaaaaa',
                    fontSize: 14
                },
                margin: 30, //刻度标签与轴线之间的距离。
            },

            axisLine: {
                show: false //不显示x轴
            },
            axisTick: {
                show: false //不显示刻度
            },
            boundaryGap: true,
            splitLine: {
                show: false,
                width: 0.08,
                lineStyle: {
                    type: "solid",
                    color: "#03202E"
                }
            }
        }],
        yAxis: [{
            splitLine: {
                show: false,
                lineStyle: {
                    color: '#eee',
                    type: 'solid'
                }
            },
            axisTick: {
                show: false
            },
            axisLine: {
                show: false
            },
            axisLabel: {
                textStyle: {
                    color: '#888'
                },
            }
        }],
        series: [
            {//柱底圆片
                name: "",
                type: "pictorialBar",
                symbolSize: [30, 20],
                symbolOffset: [0, 10],
                z: 12,
                itemStyle: {
                    "normal": {
                        color: new echarts.graphic.LinearGradient(0, 0, 0, 1, [{
                            offset: 0,
                            color: "rgba(89,211,255,1)"
                        },
                        {
                            offset: 1,
                            color: "rgba(23,237,194,1)"
                        }
                        ])
                    }
                },
                data: line
            },

            //柱体
            {
                name: '',
                type: 'bar',
                barWidth: 30,
                barGap: '0%',
                itemStyle: {
                    "normal": {
                        "color": {
                            "x": 0,
                            "y": 0,
                            "x2": 0,
                            "y2": 1,
                            "type": "linear",
                            "global": false,
                            "colorStops": [{//第一节下面
                                "offset": 0,
                                "color": "rgba(0,255,245,0.5)"
                            }, {
                                "offset": 1,
                                "color": "#43bafe"
                            }]
                        }
                    }
                },

                data: line
            },

            //柱顶圆片
            {
                name: "",
                type: "pictorialBar",
                symbolSize: [30, 20],
                symbolOffset: [0, -10],
                z: 12,
                symbolPosition: "end",
                "itemStyle": {
                    "normal": {
                        color: new echarts.graphic.LinearGradient(0, 0, 0, 1,
                            [{
                                offset: 0,
                                color: "rgba(89,211,255,1)"
                            },
                            {
                                offset: 1,
                                color: "rgba(23,237,194,1)"
                            }
                            ],
                            false
                        ),
                    }
                },
                data: line
            }
        ]
    };

    myChart.setOption(option);

    setInterval(() => {
        console.log(option.xAxis);
        let x0 = option.xAxis[0].data[0];
        let s0 = option.series[0].data[0];
        option.xAxis[0].data.shift();
        option.xAxis[0].data.push(x0);
        option.series[0].data.shift();
        option.series[0].data.push(s0);
        myChart.setOption(option);
    }, 2100);
</script>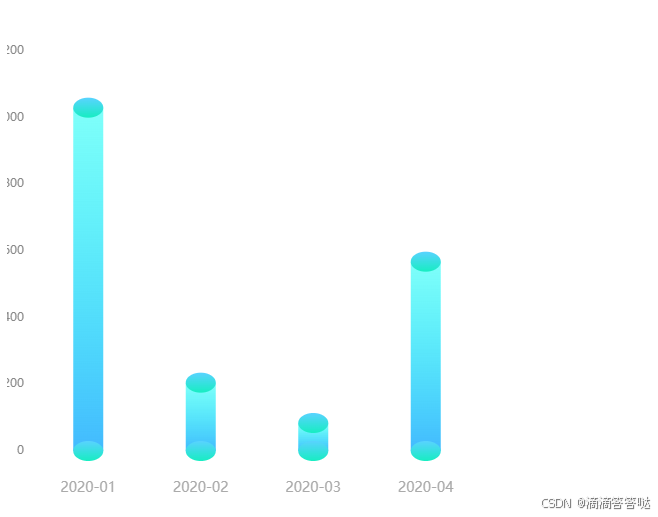


 2319
2319

 被折叠的 条评论
为什么被折叠?
被折叠的 条评论
为什么被折叠?
 到【灌水乐园】发言


