


 本文详细介绍了在MATLAB中如何进行回归分析和内插操作。针对线性回归,通过polyfit()和regress()函数确定相关性及高阶方程;在非线性情况下,利用cftool定制方程寻找参数。对于内插,讲解了interp1()和interp2()函数在1D和2D数据中的应用,以及如何通过spline()实现更平滑的插值效果。
一、回归
找到回归方程,使SSE最小
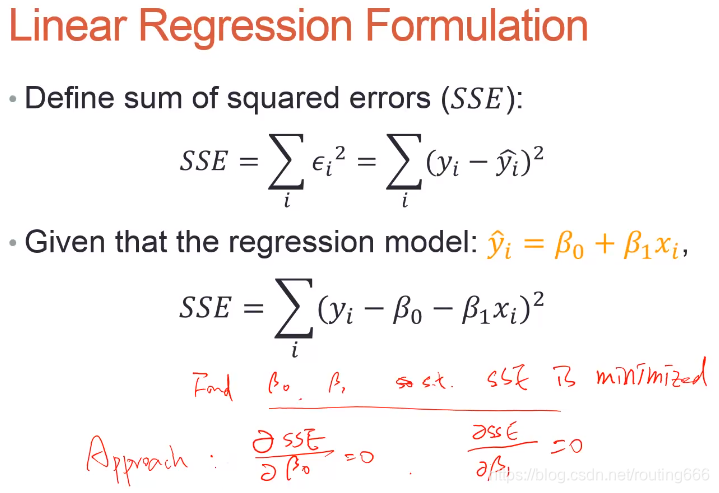
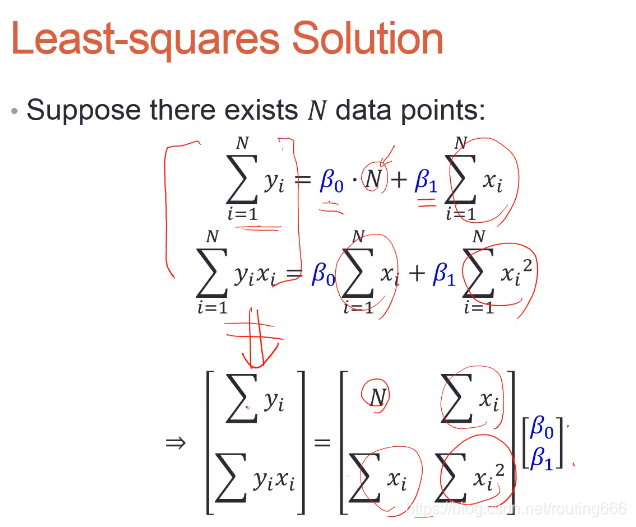
用matlab解:
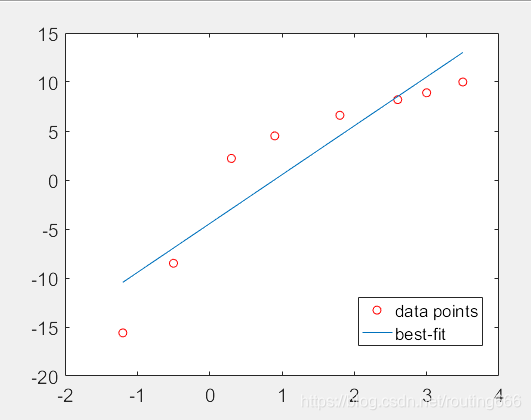
线性回归图:
polyfit()
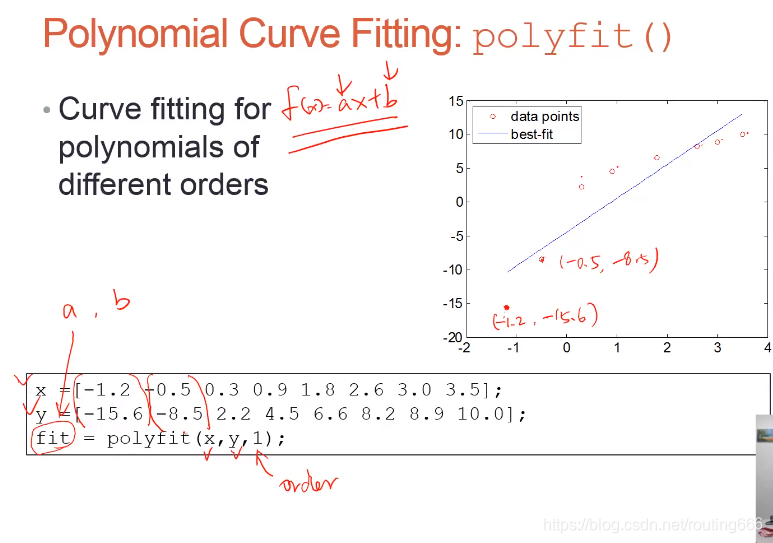
>> x = [-1.2 -0.5 0.3 0.9 1.8 2.6 3.0 3.5];
>> y = [-15.6 -8.5 2.2 4.5 6.6 8.2 8.9 10.0];
>> fit = polyfit(x,y,1);
>> fit

fit =

    4.9897   -4.4491

>> xfit = [x(1):0.1:x(end)]; yfit = fit(1)*xfit+fit(2);
>> plot(x,y,'ro',xfit,yfit); set(gca,'FontSize',14);
>> legend(2,'data points','best-fit');
确定两者是否有线性关系:
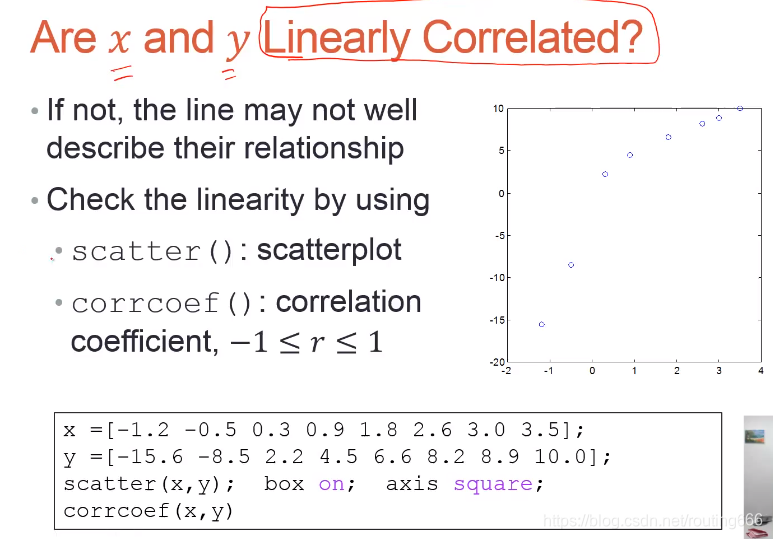
>> x = [-1.2 -0.5 0.3 0.9 1.8 2.6 3.0 3.5];
>> y = [-15.6 -8.5 2.2 4.5 6.6 8.2 8.9 10.0];
>> scatter(x,y);box on; axis square;
>> corrcoef(x,y)

ans =

    1.0000    0.9202
    0.9202    1.0000

>> 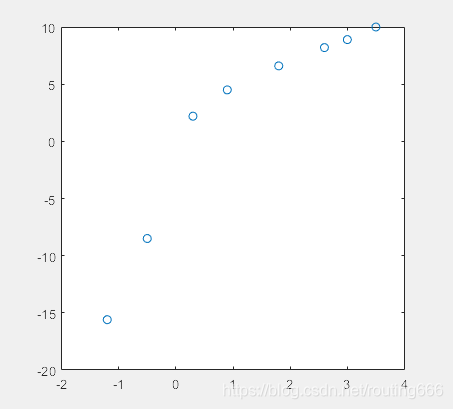
得到线性相关性:r = 0.9202
 最低0.47元/天 解锁文章


 331
331

 被折叠的 条评论
为什么被折叠?
被折叠的 条评论
为什么被折叠?
 到【灌水乐园】发言


