


1.echarts处理双柱状图方法
import * as echarts from "echarts";
import ec from '@/utils/echartConfig'

const lineProgRef = ref(null);
let bottomTimer = null
const lineProg = async () => {
  const data = [11, 2, 3, 4, 5, 6, 7, 8, 9, 10, 11, 12]
  const sideData = [220, 182, 191, 234, 290, 330, 220, 182, 191, 234, 290, 330];
  const sideData1 = [220, 182, 191, 234, 290, 330, 100, 110, 120, 134, 190, 230];

  const option = {
    tooltip: {},
    dataZoom: ec.dataZoom(data.length, 5),
    grid: { left: 20, right: "0", top: "20%", bottom: "0", containLabel: true, },
    legend: { selectedMode: false, right: 0, top: 20, itemHeight: 10, itemWidth: 10, textStyle: { color: "#fff" }, },
    xAxis: { axisTick: { show: false }, axisLine: { lineStyle: { color: "#B3BCB9" } }, data: ['01', '02', '03', '04', '05', '06', '07', '08', '09', '10', '11', '12'] },
    yAxis: { splitLine: { lineStyle: { type: 'dotted', color: "#3a4760" }, }, axisLine: { show: false }, axisLabel: { color: "#B3BCB9" } },
    series: [
      {
        name: "任务数量",
        tooltip: { show: false },
        type: "bar",
        barWidth: 10,
        itemStyle: {
          color: new echarts.graphic.LinearGradient(0, 1, 0, 0, [{ offset: 0, color: "rgba(22, 160, 164, 0.9)" }, { offset: 1, color: "#0A57A4" },], false),
        },
        data: sideData,
        barGap: 0,
      },
      {
        name: "任务数量",
        type: "bar",
        barWidth: 10,
        itemStyle: {
          color: new echarts.graphic.LinearGradient(0, 1, 0, 0, [{ offset: 0, color: "rgba(61, 248, 253, 0.9)" }, { offset: 1, color: "#1A95F8" },], false),
        },
        barGap: 0,
        data: sideData,
      },
      {
        name: "任务数量",
        tooltip: { show: false },
        type: "pictorialBar",
        itemStyle: {
          borderWidth: 1,
          borderColor: "#0571D5",
          color: "#00D7E9", // 控制顶部方形的颜色
        },
        symbol: "path://M 0,0 l 90,0 l -60,60 l -90,0 z",
        symbolSize: ["20", "7"], // 第一个值控制顶部方形大小
        symbolOffset: ["-10", "-4"], // 控制顶部放行 左右和上下
        symbolRotate: -16,
        symbolPosition: "end",
        data: sideData,
        z: 3,
      },
      {
        name: "完成数量",
        tooltip: { show: false },
        type: "bar",
        barWidth: 10,
        itemStyle: {
          color: new echarts.graphic.LinearGradient(0, 1, 0, 0, [{ offset: 0, color: "#8C1912" }, { offset: 1, color: "#B07116" }], false),
        },
        data: sideData1,
        barGap: 0,
      },
      {
        name: "完成数量",
        type: "bar",
        barWidth: 10,
        itemStyle: {
          color: new echarts.graphic.LinearGradient(0, 1, 0, 0, [{ offset: 0, color: "#FF2F22" }, { offset: 1, color: "#F8A122" }], false),
        },
        barGap: 0,
        data: sideData1,
      },
      {
        name: "完成数量",
        tooltip: { show: false },
        type: "pictorialBar",
        itemStyle: {
          borderWidth: 1,
          borderColor: "#fff",
          color: "#FFC37B", // 顶部方块的颜色
        },
        symbol: "path://M 0,0 l 90,0 l -60,60 l -90,0 z",
        symbolSize: ["20", "7"], // 第一个值控制顶部方形大小
        symbolOffset: ["10", "-4"], // 控制顶部放行 左右和上下
        symbolRotate: -16,
        symbolPosition: "end",
        data: sideData1,
        z: 3,
      },
    ],
  };
  const myChart = echarts.init(lineProgRef.value)
  myChart.setOption(option);
  // 自定轮播
  const automaticEC = () => ec.autoMove(myChart, option, data.length)
  automaticEC()
  // 鼠标移入停止轮播
  myChart.on('mouseover', () => clearInterval(option.timer))
  // 鼠标离开继续轮播
  myChart.on('mouseout', automaticEC)
  // 保存定时器id,离开页面停止定时器
  bottomTimer = option.timer
};
2.echartConfig.js封装配置文件
实现超过指定个数显示滚动条、自动轮播方法等
export default {
xAxis: {
nameTextStyle: { color: "#fff" },
axisLabel: { color: '#fff' },
axisTick: { show: false },
splitLine: { lineStyle: { color: 'rgba(255, 255, 255, 0.2)' } },
},
yAxis: {
nameTextStyle: { color: "#fff" },
axisLabel: { color: '#fff' },
axisTick: { show: false },
splitLine: { lineStyle: { color: 'rgba(255, 255, 255, 0.2)' } },
},
grid: { left: 0, right: 0, bottom: 0, containLabel: true },
/**
* echarts x轴滚动条
* @param {Number} dataLength series.data数组长度
* @param {Number} endValue 一次显示多少条
* @param {Boolean} yAxisIndex 滚动条显示位置,默认x轴,true为y轴显示
* @returns datazoom对象
*/
dataZoom: (dataLength = 0, endValue = 11, yAxisIndex = false) => {
return {
[yAxisIndex && 'yAxisIndex']: 0,
show: dataLength > endValue ? true : false,
type: 'slider',
startValue: 0,
endValue,
showDataShadow: false,
textStyle: false,
// 滚动条颜色
fillerColor: 'rgba(17, 145, 185, 1)',
moveHandleSize: 0,
// 边框
borderColor: 'rgba(112, 112, 112, 0.23)',
// 滚动条背景
backgroundColor: 'rgba(112, 112, 112, 0.23)',
height: yAxisIndex ? '80%' : 6,
[yAxisIndex && 'width']: yAxisIndex && 6,
[yAxisIndex && 'right']: yAxisIndex && 0,
bottom: 15,
handleStyle: { borderWidth: 0, color: 'rgba(17, 145, 185, 1)' }
}
},
/**
* 两种颜色渐变
* @param {String} start 开始颜色
* @param {String} end 结束颜色
* @param {String} type true从左向右 : 从下往上
* @returns
*/
newColor: (start, end, type) => {
return { x: type ? 1 : 0, y: 0, x2: 0, y2: type ? 0 : 1, colorStops: [{ offset: 0, color: start }, { offset: 1, color: end }] }
},
/**
* 三种颜色渐变-->颜色从左往右
* @param {String} start 开始颜色
* @param {String} end 结束颜色
* @returns
*/
newColor3: (start, end) => {
return { x: 1, y: 0, x2: 0, y2: 1, colorStops: [{ offset: 0, color: start }, { offset: 0.95, color: end }, { offset: 1, color: '#000' }] }
},
/**
* echarts图标自动滚动
* @param {object} documentEC echarts实例对象
* @param {object} option echarts图表配置
* @param {Number} dataLength series.data数组长度
* @param {Number} endValue 一次显示多少条
*/
autoMove: (documentEC, option, dataLength, endValue = 5) => {
option.timer = setInterval(() => {
if (Number(option?.dataZoom.endValue) === dataLength - 1) {
option.dataZoom.endValue = endValue;
option.dataZoom.startValue = 0;
} else {
option.dataZoom.endValue = option?.dataZoom.endValue + 1;
option.dataZoom.startValue = option?.dataZoom.startValue + 1;
}
documentEC.setOption(option);
}, 5000);
}
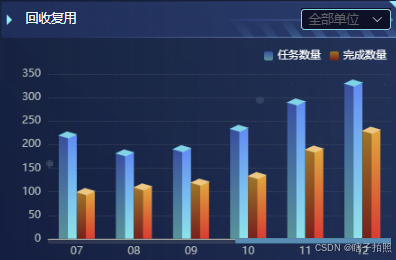
}3.实现效果


 被折叠的 条评论
为什么被折叠?
被折叠的 条评论
为什么被折叠?
 到【灌水乐园】发言


