


任务要求
熟悉Jupyter环境下的python编程,在Jupyter下完成一个鸢尾花数据集的线性多分类、可视化显示与测试精度实验。
可参考附件1的ipynb文件或者网络资源,如
https://www.cnblogs.com/baby-lily/p/10639570.html
一、jupyter notebook
1、使用anaconda安装jupyter
官网下载:https://www.anaconda.com/download/
安装完成后如下:
2、在终端输入conda install jupyter安装jupyter
3、安装完成后使用命令打开jupyter notebook命令打开jupter页面
二、鸢尾花数据集处理
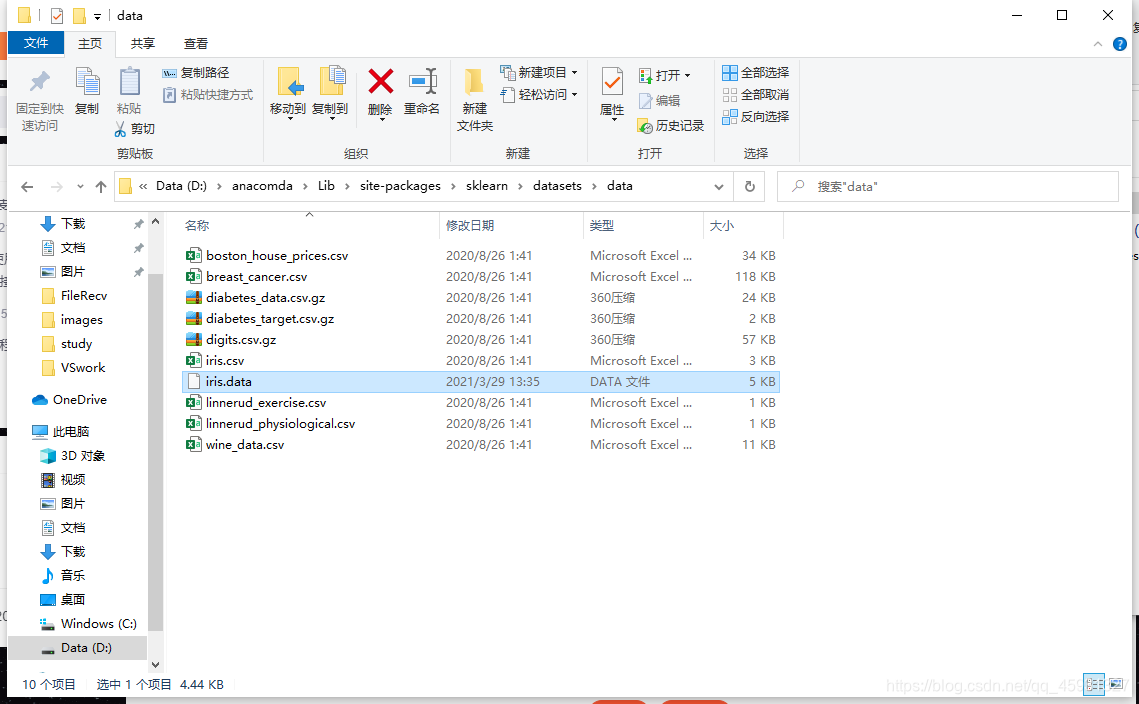
1.数据集的准备,将链接中数据集添加到sklearn目录下的data文件夹下
路径:D:\anacomda\Lib\site-packages\sklearn\datasets\data
计算
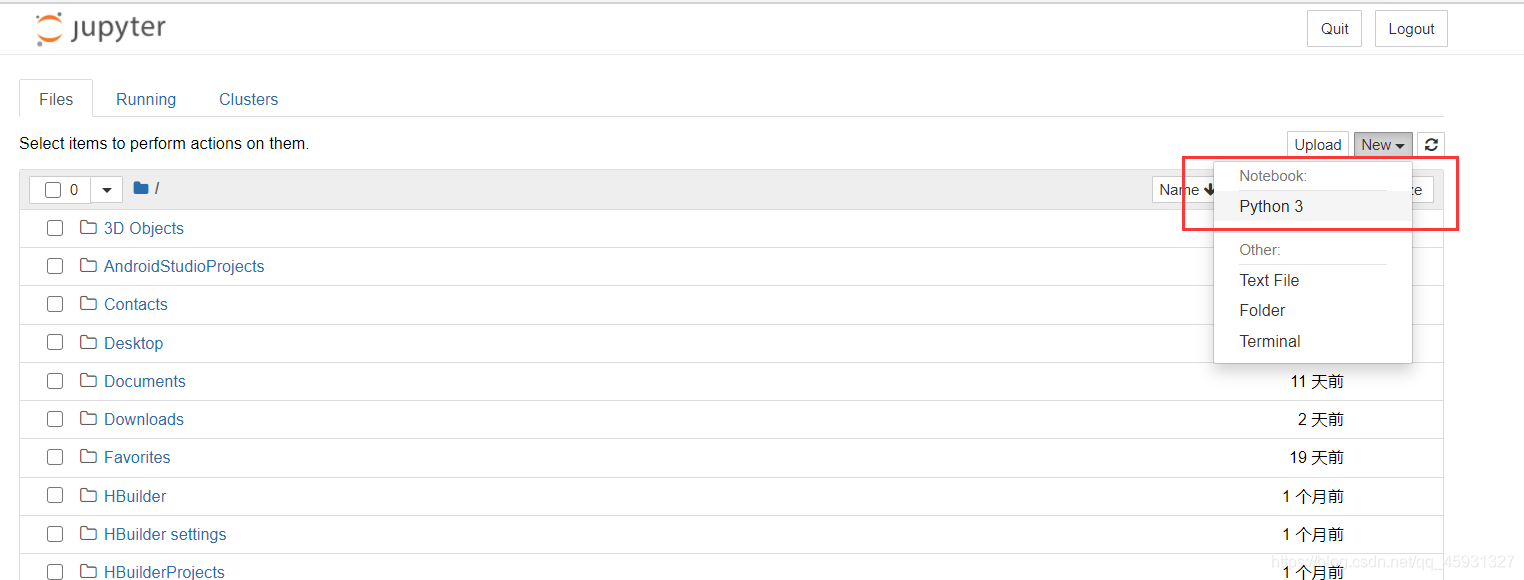
1、打开jupyter,new选择python3,
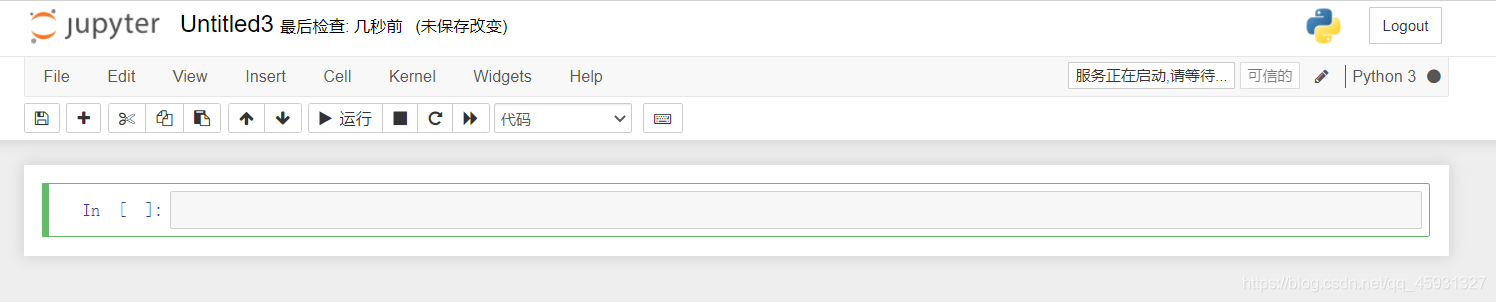
2.在新打开的窗口代码编写处写代码
3.库导入:
import numpy as np
from sklearn.linear_model import LogisticRegression
import matplotlib.pyplot as plt
import matplotlib as mpl
from sklearn import preprocessing
import pandas as pd
from sklearn.preprocessing import StandardScaler
from sklearn.pipeline import Pipeline
4、对各个变量进行赋值,取出数据集,代码如下
df = pd.read_csv('D:\Anaconda\Lib\site-packages\sklearn\datasets\datairis.data', header=0)
x = df.values[:, :-1]
y = df.values[:, -1]
le = preprocessing.LabelEncoder()
le.fit(['Iris-setosa', 'Iris-versicolor', 'Iris-virginica'])
y = le.transform(y)
5、构建线性模型,代码如下
x = x[:, :2]
x = StandardScaler().fit_transform(x)
lr = LogisticRegression()   # Logistic回归模型
lr.fit(x, y.ravel())        # 根据数据[x,y],计算回归参数
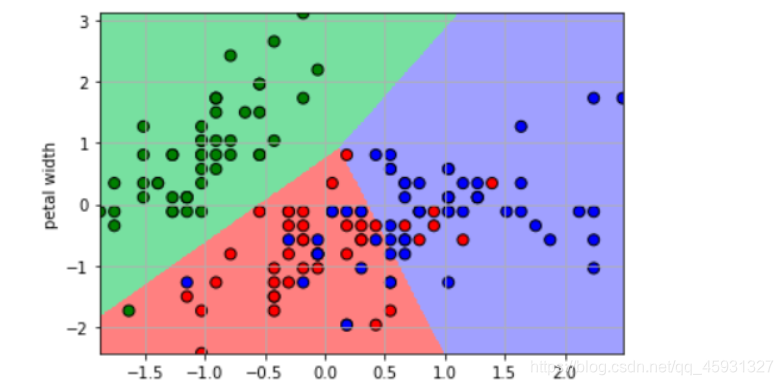
6、可视化显示,代码如下
N, M = 500, 500     # 横纵各采样多少个值
x1_min, x1_max = x[:, 0].min(), x[:, 0].max()   # 第0列的范围
x2_min, x2_max = x[:, 1].min(), x[:, 1].max()   # 第1列的范围
t1 = np.linspace(x1_min, x1_max, N)
t2 = np.linspace(x2_min, x2_max, M)
x1, x2 = np.meshgrid(t1, t2)                    # 生成网格采样点
x_test = np.stack((x1.flat, x2.flat), axis=1)   # 测试点
cm_light = mpl.colors.ListedColormap(['#77E0A0', '#FF8080', '#A0A0FF'])
cm_dark = mpl.colors.ListedColormap(['g', 'r', 'b'])
y_hat = lr.predict(x_test)       # 预测值
y_hat = y_hat.reshape(x1.shape)                 # 使之与输入的形状相同
plt.pcolormesh(x1, x2, y_hat, cmap=cm_light)     # 预测值的显示
plt.scatter(x[:, 0], x[:, 1], c=y.ravel(), edgecolors='k', s=50, cmap=cm_dark)
plt.xlabel('petal length')
plt.ylabel('petal width')
plt.xlim(x1_min, x1_max)
plt.ylim(x2_min, x2_max)
plt.grid()
plt.savefig('2.png')
plt.show()
7、该模型的准确率计算
y_hat = lr.predict(x)
y = y.reshape(-1)
result = y_hat == y
acc = np.mean(result)
print('准确度: %.2f%%' % (100 * acc))
8.运行结果
参考博客:参考线性分类的jupyter时间练习


 408
408

 被折叠的 条评论
为什么被折叠?
被折叠的 条评论
为什么被折叠?
 到【灌水乐园】发言


