2020年高教社杯全国大学生数学建模竞赛题目D题 接触式轮廓仪的自动标注

  轮廓仪是一种两坐标测量仪器(见图1),它由工作平台、夹具、被测工件、探针、传感器和伺服驱动等部件组成(见图2)。
在这里插入图片描述

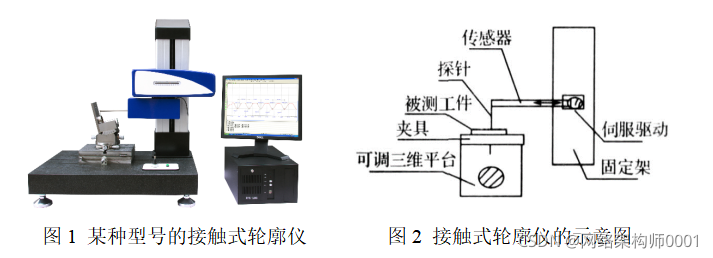
  接触式轮廓仪的工作原理是,探针接触到被测工件表面并匀速滑行,传感器感受到被测表面的几何变化,在X和Z方向分别采样,并转换成电信号。该电信号经放大等处理,转换成数字信号储存在数据文件中(见图3)。
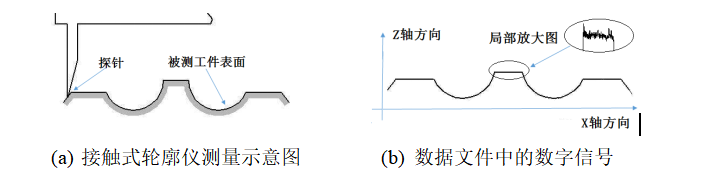
在这里插入图片描述
        图3 接触式轮廓仪的工作原理

  在理想状况下,轮廓曲线应该是光滑的,但由于接触式轮廓仪存在探针沾污、探针缺陷、扫描位置不准等问题,检测到的轮廓曲线呈现出粗糙不平的情况(见图3(b)中的局部放大图),这给工件形状的准确标注带来影响。

  为了简化问题,假设被测工件的轮廓线是由直线和圆弧构成的平面曲线(见图4)。请建立数学模型,并根据附件1(工件1的水平和倾斜测量数据)、附件2~附件4(工件2的多次测量数据)所提供的轮廓仪测量数据,研究下列问题:
  1.附件1中的表level是工件1在水平状态下的测量数据,其轮廓线如图4所示,请标注出轮廓线的各项参数值:槽口宽度(如等)、圆弧半径(如等)、圆心之间的距离(如等)、圆弧的长度、水平线段的长度(如等)、斜线线段的长度、斜线与水平线之间的夹角(如等)和人字形线的高度()。
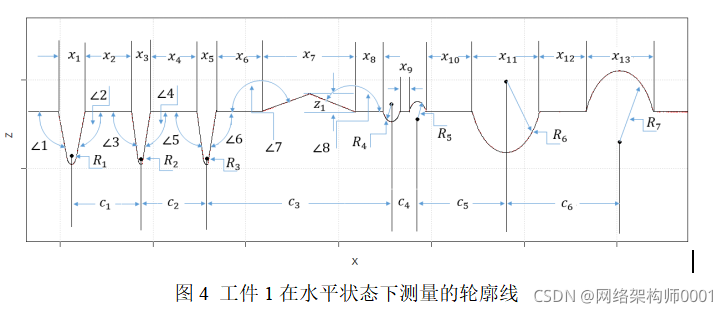
在这里插入图片描述
        图4 工件1在水平状态下测量的轮廓线
问题2.同一工件在不同次测量时,由于工件放置的角度和位置不同,轮廓线参数的计算值也会存在差异。附件1中的表down给出了工件1在倾斜一个角度和有一些水平位移状态下轮廓线的测量数据。请计算该工件测量时的倾斜角度,并作水平校正。在数据校正后,完成问题1的任务,并比较两种测量状态下工件1各项参数计算值之间的差异。

问题3.在对工件作多次检测时,工件每次放置的角度、测量的起点和终点都会有偏差,这导致了每次测量实际是对整个工件中的某一部分进行检测。附件2提供了对工件2的10次测量数据,请基于这些数据完成:(1) 每次测量时工件2的倾斜角度;(2) 标注出工件2轮廓线的各项参数值(同问题1);(3) 画出工件2的完整轮廓线。

问题4.为了更准确地标注出工件2的各项参数值,附件3和附件4分别提供了工件2关于圆和角的9次局部测量数据,请利用这些数据修正问题3的结论,并对该工件的完整轮廓线作进一步修正。

summary: In this paper, we establish a regression model based on the passing network to evaluate the influence of team structure strategy and opponents’ counter-strategy on the match results. Fortask1,wefirstlistsomeHuskiesmatchstatisticsforthisseasonandanalyzetheteamin brief. Secondly, we construct a passingnetwork based on the number of passes and visualizes the passing network diagram of three games under three different coaches. We use these three diagrams to describe and compare the changes in Huskies’ strategies. After that, we identify network patterns of dyadic and triadic configurations and count 15 kinds of these two configurations in the above three matches, reflecting the structural indicators of the passing network. We also explore time scale and micro scale by giving the change of the team’s centroid over time in the first match and the Huskies’ 4 positions heat map over the season. For task 2, we construct the regression model not only introducing the basic data representing Huskies’ and opponents’ ability, but also extracting six independent variables from the indicators of the passing network into the model. Considering opponents’ counter-strategies, we also introduce the product interaction term between opponents’ data and network structure indicators. Through the training of regression model, we can judge whether the independent variables introduced have influence, what kind of influence and how much influence the independent variables introduced have on the result of the match. For task 3, by bringing in data for training, the model leaves 10 variables including interactionterms. Inordertoverifytheaccuracyofthemodel,weuseLeaveOneOutcrossvalidation, andthepredictedaccuracyoftheraceresultreached71.05%. Then,basedonthetrainedmodel, we point out the effective structural strategies Huskies currently have, such as the strong connection between the core players. Meanwhile, we also give specific advice for Huskies team to improve team success, such as the emphasis on triadic configurations among players. Fortask4,weextendthemodelappliedtohuskiestoallteamworkscenariosandintroduce the IPOI model. The IPOI model conducts multi-level induction of influencing factors and selection of assessment indicators from the four aspects of team input, process, output and reinput, taking into account team construction, operation, management, feedback and other aspects. WeconsiderthattheexistingHuskiemodelisprogresspartofIPOImodel,andweadd the evaluation system of input, output and reinput part, taking the university scientific research team modeling as an example. Insummary,ourmodelispracticalandreliableforhandlingnetwork-basedteamworkproblems in society. Keywords: football strategy, network science, regression analysis, IPOI model.
2020 高教全国大学生数学建模竞赛题目 a 炉温曲线要求我们根据给定的数据和条件,分析和模拟炉温曲线的变化过程。 首先,我们需要仔细阅读题目,理解所给的条件和要求。根据题目,在竞赛中,我们被要求利用给定的炉温测量数据来建立一个时间与炉温之间的数学模型,即炉温曲线。我们需要根据给定的数据点,找到一个最优的数学函数来拟合这些数据点,以预测和分析炉温的变化趋势。 接下来,我们可以先对给定的数据进行处理和分析,找出其中的规律和特点。通过查看数据点的变化趋势和分布规律,我们可以初步判断所给的数据可能满足某种函数关系,如指数函数、对数函数或多项式函数等。在得出初步结论后,我们可以使用数学软件或编程语言来进行数据处理和拟合。 在进行数据拟合的过程中,我们可以尝试不同的函数形式,并通过最小二乘法等统计方法来比较不同函数的拟合优度,从而选择最优的函数。 最后,结合所选择的最优函数形式,我们可以得到一个数学模型,即炉温曲线。这个模型可以用于预测和分析炉温在未来时间内的变化趋势,提供参考和决策依据。 总之,2020 高教全国大学生数学建模竞赛题目 a 炉温曲线要求我们利用给定的数据和条件,通过数据处理、拟合分析和数学建模等方法,建立一个时间与炉温之间的数学模型,以实现对炉温变化趋势的预测和分析。这个过程需要运用数学知识和技巧,同时结合计算机辅助工具进行数据处理和模型构建。
评论
添加红包

请填写红包祝福语或标题

红包个数最小为10个

红包金额最低5元

当前余额3.43前往充值 >
需支付:10.00
成就一亿技术人!
领取后你会自动成为博主和红包主的粉丝 规则
hope_wisdom
发出的红包

打赏作者

云计算架构师0001

你的鼓励将是我创作的最大动力

¥1 ¥2 ¥4 ¥6 ¥10 ¥20
扫码支付:¥1
获取中
扫码支付

您的余额不足,请更换扫码支付或充值

打赏作者

实付
使用余额支付
点击重新获取
扫码支付
钱包余额 0

抵扣说明:

1.余额是钱包充值的虚拟货币,按照1:1的比例进行支付金额的抵扣。
2.余额无法直接购买下载,可以购买VIP、付费专栏及课程。

余额充值