


 这篇博客介绍了如何使用R进行单因素方差分析(ANOVA)及其后续检验,包括Kruskal-Wallis检验。内容涵盖了ANOVA的基本原理、假设,以及数据导入、模型构建、假设检验、结果解释等步骤,并通过具体实例演示了如何进行posthoc测试和计划对比。此外,还讨论了当ANOVA假设不成立时,如何使用Kruskal-Wallis非参数检验作为替代方法。
NOTES
1 Intruduction of ANOVA
1.1 terminology
If we have 4 groupps of samples, with mean μ1,μ2,μ3,μ4\mu_1, \mu_2, \mu_3, \mu_4μ1,μ2,μ3,μ4, respectively. If we use t-test to test whether the means of 4 population are equle, we have to repeat 6 times t-test.
If all tests are made at some specified significance level (the possibility of error I α\alphaα), the overall level of 6 tests together will be 1−(1−α)6=0.625>>0.051-(1-\alpha)^6 = 0.625 >> 0.051−(1−α)6=0.625>>0.05.
Generally speaking, with the increase of the times of carrying on the significant test, the significant level will decrease.
ANOVA (analysis of variance) is used to test equality of multiple overall mean value.
Suppose we want to compare the quality of different industries according to the number of complaints received.
Here, the object be tested (diferent industries) is defined as factor, and the proformence of the factor(the number of complaints received) is defined as treatment. One-way anova means there are only one factor.
1.2 Principles and basic ideas
- describe with plot
Using scatter plot to explore the data, and check the diference. - error separation
SST: Reflecting the error of all datas.
SSE: Reflecting the with-in group error.
SSA: Reflecting the group error. - error analysis
Analyse where the error comes from, with-in group or between group.
1.3 Assumption
- The populations are normal distributions.
- The populations have the same variance.
- observation is independent.
Typically:
H0:μ1=μ2=...=μkH1:μi≠μjfor some pair(i,j) H_0: \mu_1=\mu_2=...=\mu_k \\ H_1: \mu_i \ne \mu_j\quad for\ some\ pair(i, j) H0:μ1=μ2=...=μkH1:μi=μjfor some pair(i,j)
Exrcise
Start by installing (if needed) and loading:
- car
- lmtest
- multcomp
One-way anova analysis is used when we want to see if the mean of a continuous variable differs between groups (i.e. between levels of a single categorical variable, a.k.a. factor). It is a generalisation of the t-test, and can be applied to more than two groups. The significance of the categorical variable depends on the relationship between the within-group variance and the among-group variance. If the differences between groups are large compared to the variation within each group, then the categorical variable is likely to be significant. If you are comparing more than two groups, some follow-up analysis (a posthoc test or planned comparison/contrast) is usually necessary to determine exactly which groups differ from each other.
One-way anova with posthoc test
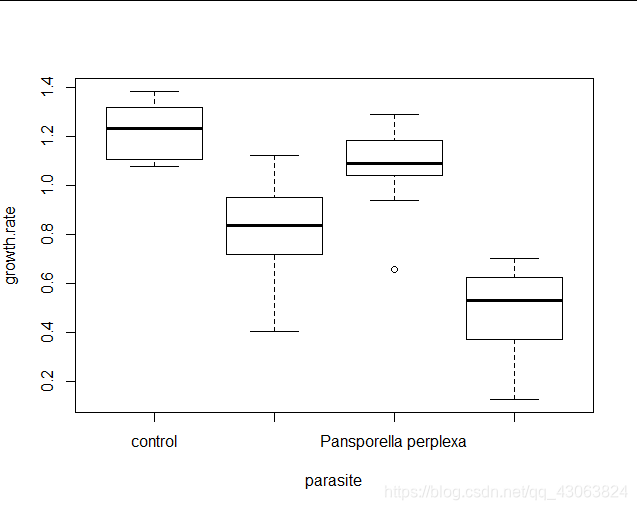
We will start off with an example, an analysis of how Daphnia growth rates depend on what type of parasite individuals are infected with. There were 4 treatments; control and three different species of parasite.
1 Data import and exploration
daphnia = read.csv("daphniagrowth.csv")
boxplot(growth.rate~parasite, data = daphnia)
2 Construct one-way anova model
Believe it or not, but a one-way anova is just another type of linear model. R knows that this data should be analysed using a one-way anova because parasiteis a factor. Because of the flexibility of the linear
 最低0.47元/天 解锁文章


 1165
1165

 被折叠的 条评论
为什么被折叠?
被折叠的 条评论
为什么被折叠?
 到【灌水乐园】发言


