


 本文详细探讨了matplotlib库在Python中的使用,包括创建各种图表,调整样式,自定义元素等,旨在帮助读者掌握高效的数据可视化技巧。
import numpy as np
import matplotlib.pyplot as plt
import scipy.io as scio

def load_mat_file():
    map_data = '../query_gallery_compar/map.mat'
    rank1_data = '../query_gallery_compar/rank1.mat'
    data_map = scio.loadmat(map_data)
    data_rank1 = scio.loadmat(rank1_data)

    return data_map['mAP'], data_rank1['rank1']

def plot_curves(input_data):

    max_step = 3400
    legend_font = {'family' : 'Times New Roman',
                   'weight' : 'normal',
                   'size'   : 6,}
    label_font  = {'family' : 'Times New Roman',
                   'weight' : 'normal',
                   'size'   : 6,}
    title_font  = {'family' : 'Times New Roman',
                   'weight' : 'normal',
                   'size'   : 6,}
    ticks_font  = {'family' : 'Times New Roman',
                   'weight' : 'normal',
                   'size'   : 20,}
    img2img = 'Image-Image'
    img2vid = 'Image-Video'
    vid2img = 'Video-Image'
    vid2vid = 'Video-Video'


    color  =  {img2img:  'blue', # (99/255, 147/255, 112/255), # 'lightgreen',
               img2vid:   'burlywood',#(163/255, 163/255, 163/255),
               vid2img: 'blueviolet',  # (124/255, 72/255, 96/255),
               vid2vid: 'red', # (163/255, 163/255, 163/255)
               }
    line_style  =  {img2img: ':',
                    img2vid: '--',
                    vid2img: '-.',
                    vid2vid: '-'
                    }
    marker_style  =  {img2img: '+',
                      img2vid: 'x',
                      vid2img: 'o',
                      vid2vid: '^'
                      }
    y_bottom = [0.65, 0.3, 0.3,0.3,0.65]
    y_top = [0.9, 0.85, 0.85, 0.85, 0.9]
    legend_ybot = [0.3, 0.2, 0.2]

    ###fig, axs = plt.subplots(2, 1, figsize=(15, 3.3))
    fig1, ax1 = plt.subplots(1, 1, figsize=(4, 4))
    fig2, ax2 = plt.subplots(1, 1, figsize=(4, 4))

    for ax, fig_name, fig_data in zip([1,2], input_data.keys(), input_data.values()):
        if ax == 1:
            ax = ax1
        else:
            ax = ax2
        sequence = [img2img, img2vid, vid2img, vid2vid]
        x = range(25,801,25)
        for i, label in enumerate(sequence):
            assert len(x) == len(fig_data[:, i])
            ax.plot(x, fig_data[:, i], label=label, color=color[label], linestyle = line_style[label], linewidth=1, marker = marker_style[label], markersize=4)
        ax.legend(prop = legend_font, edgecolor=(0, 0, 0), fancybox=False,loc= 2)
        # ax.set_title('{} Evaluation'.format(fig_name), fontdict=title_font)

        ax.spines['top'].set_linewidth(1)
        ax.spines['right'].set_linewidth(1)
        ax.spines['bottom'].set_linewidth(1); ###设置底部坐标轴的粗细
        ax.spines['left'].set_linewidth(1);   ####设置左边坐标轴的粗细
        ax.tick_params(direction='in', width=1)
        ###ax.grid(axis="y")
        ax.grid(True, 'major', 'x', ls='--', lw=.5, c='k', alpha=.3)
        ax.grid(True, 'major', 'y', ls='--', lw=.5, c='k', alpha=.3)
        ax.set_xlabel('Number of Epochs', fontdict=label_font)
        ax.set_ylabel('{}(%)'.format(fig_name), fontdict=label_font)
        ax.set_xlim(0, 820)
        ax.set_ylim(15, 50)
        ax.set_xticks(range(100, 801, 100))
        ax.tick_params(labelsize=12)
        #plt.xticks([4, 8, 12, 16, 20, 24, 28, 32], ['100', '200', '300', '400', '500', '600', '700', '800'])
        ###ax.set_xticks([4, 8, 12, 16, 20, 24, 28, 32], ['aa', 'bb', 'bb', '4bb00', '50bb0', '60bb0', '70bb0', 'bb'])
    # fig1.tight_layout() #调整整体空白

    plt.subplots_adjust(wspace =0, hspace =0.25)#调整子图间距
    plt.show()


if __name__ == '__main__':

    data_map, data_rank1 = load_mat_file()
    data=dict()
    data['mAP'] = data_map
    data['Rank-1'] = data_rank1
    plot_curves(data)


import matplotlib.pyplot as plt
import pandas as pd
import matplotlib.pylab as pl
# from matplotlib.ticker import FuncFormatter ### 今天的主角
import numpy as np
plt.rc('font',family='Times New Roman')
def main(data_path):
results = pd.read_excel(data_path)
h, w = results['h'].values, results['w'].values
r_std, sqr_std = results['r_std'].values, results['sqr_std'].values
recurs = results['recurrents'].values
#读取个区间柱状图数量
a1 = len(results.loc[results['sqr_std']<= 25])
a2 = len(results.loc[(results['sqr_std']> 25 )&(results['sqr_std']<= 50)])
a3 = len(results.loc[(results['sqr_std']> 50 )&(results['sqr_std']<= 75)])
a4 = len(results.loc[(results['sqr_std']> 75 )&(results['sqr_std']<= 100)])
a5 = len(results.loc[(results['sqr_std']> 100 )&(results['sqr_std']<= 125)])
a6 = len(results.loc[(results['sqr_std']> 125 )&(results['sqr_std']<= 150)])
a7 = len(results.loc[(results['sqr_std']> 150 )&(results['sqr_std']<= 175)])
a8 = len(results.loc[results['sqr_std']> 175])
b = a1+a2+a3+a4+a5+a6+a7+a8
y1, y2= [],[]
# 转换成百分比
y1.append(a1/b)
y1.append(a2/b)
y1.append(a3/b)
y1.append(a4/b)
y1.append(a5/b)
y1.append(a6/b)
y1.append(a7/b)
y1.append(a8/b)
y2.append((b-a1)/ b)
y2.append((b-a2)/ b)
y2.append((b-a3)/ b)
y2.append((b-a4)/ b)
y2.append((b-a5)/ b)
y2.append((b-a6)/ b)
y2.append((b-a7)/ b)
y2.append((b-a8)/ b)
# print(y1, y2)
x_data = ['0-25','25-50','50-75','75-100','100-125','125-150','150-175','>175']
plt.ylim(0,0.5)
# marks = ['*','*']
# y = np.random.randint(20,180,len(marks))
plt.bar(x = x_data, height=y1, color= 'b', alpha=0.8, )
# plt.bar(x = x_data, height=y2, color = 'r' ,alpha=0.8, bottom=y1)
axes = plt.subplot(111)
axes.bar(x = x_data, height = y2, hatch='x', color='white', edgecolor='gray',bottom=y1, alpha=0.1)
#绘制百分比
for x, y in enumerate(y1):
plt.text(x-0.35, 0.5, '%s' % format(y,'.2%'), va='top',color = 'black',rotation=30)
plt.yticks([])
axes.spines['top'].set_visible(False) #设置边框
axes.spines['right'].set_visible(False)
axes.spines['bottom'].set_visible(False)
axes.spines['left'].set_visible(False)
plt.xticks([0, 1, 2, 3, 4, 5, 6, 7],['0-25','25-50','50-75','75-100','100-125','125-150','150-175','>175'],rotation=30,fontproperties = 'Times New Roman', size = 14)
plt.show()
d1 = len(results.loc[results['recurrents']<= 1])
d2 = len(results.loc[(results['recurrents']> 1 )&(results['recurrents']<= 2)])
d3 = len(results.loc[(results['recurrents']> 2 )&(results['recurrents']<= 3)])
d4 = len(results.loc[(results['recurrents']> 3 )&(results['recurrents']<= 4)])
d5 = len(results.loc[(results['recurrents']> 4 )&(results['recurrents']<= 5)])
d6 = len(results.loc[(results['recurrents']> 5 )&(results['recurrents']<= 6)])
d7 = len(results.loc[(results['recurrents']> 6 )&(results['recurrents']<= 7)])
d8 = len(results.loc[(results['recurrents']> 7 )&(results['recurrents']<= 8)])
d9 = len(results.loc[results['recurrents']> 8])
b2 = d1+d2+d3+d4+d5+d6+d7+d8+d9
recurs1, recurs2 = [], []
recurs1.append(d1/b2)
recurs1.append(d2/b2)
recurs1.append(d3/b2)
recurs1.append(d4/b2)
recurs1.append(d5/b2)
recurs1.append(d6/b2)
recurs1.append(d7/b2)
recurs1.append(d8/b2)
recurs1.append(d9/b2)
recurs2.append((b2-d1)/ b2)
recurs2.append((b2-d2)/ b2)
recurs2.append((b2-d3)/ b2)
recurs2.append((b2-d4)/ b2)
recurs2.append((b2-d5)/ b2)
recurs2.append((b2-d6)/ b2)
recurs2.append((b2-d7)/ b2)
recurs2.append((b2-d8)/ b2)
recurs2.append((b2-d9)/ b2)
# print(y1, y2)
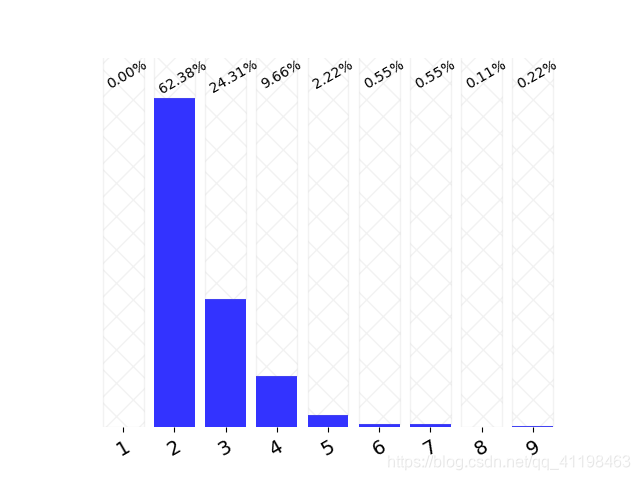
x_data_recurs = ['1','2','3','4','5','6','7','8','9']
plt.ylim(0,0.7)
plt.bar(x = x_data_recurs, height=recurs1, color= 'b', alpha=0.8, )
# plt.bar(x = x_data, height=y2, color = 'r' ,alpha=0.8, bottom=y1)
axes = plt.subplot(111)
axes.bar(x = x_data_recurs, height = recurs2, hatch='x', color='white', edgecolor='gray',bottom=recurs1, alpha=0.1)
for x, y in enumerate(recurs1):
plt.text(x-0.35, 0.7, '%s' % format(y,'.2%'), va='top',color = 'black',rotation=30)
plt.yticks([])
axes.spines['top'].set_visible(False)
axes.spines['right'].set_visible(False)
axes.spines['bottom'].set_visible(False)
axes.spines['left'].set_visible(False)
plt.xticks([0, 1, 2, 3, 4, 5, 6, 7, 8],['1','2','3','4','5','6','7','8','9'],rotation=30,fontproperties = 'Times New Roman', size = 14)
plt.show()
c1 = len(results.loc[results['r_std']<= 0.1])
c2 = len(results.loc[(results['r_std']> 0.1 )&(results['r_std']<= 0.2)])
c3 = len(results.loc[(results['r_std']> 0.2 )&(results['r_std']<= 0.3)])
c4 = len(results.loc[(results['r_std']> 0.3 )&(results['r_std']<= 0.4)])
c5 = len(results.loc[(results['r_std']> 0.4 )&(results['r_std']<= 0.5)])
c6 = len(results.loc[(results['r_std']> 0.5 )&(results['r_std']<= 0.6)])
c7 = len(results.loc[results['r_std']> 0.6])
b3 = c1+c2+c3+c4+c5+c6+c7
r_std1, r_std2 = [], []
r_std1.append(c1/b3)
r_std1.append(c2/b3)
r_std1.append(c3/b3)
r_std1.append(c4/b3)
r_std1.append(c5/b3)
r_std1.append(c6/b3)
r_std1.append(c7/b3)
r_std2.append((b3-c1)/ b3)
r_std2.append((b3-c2)/ b3)
r_std2.append((b3-c3)/ b3)
r_std2.append((b3-c4)/ b3)
r_std2.append((b3-c5)/ b3)
r_std2.append((b3-c6)/ b3)
r_std2.append((b3-c7)/ b3)
# print(y1, y2)
x_data_recurs = ['0-0.1','0.1-0.2','0.2-0.3','0.3-0.4','0.4-0.5','0.5-0.6','0.6-0.7']
plt.ylim(0,0.6)
plt.bar(x = x_data_recurs, height=r_std1, color= 'b', alpha=0.8, )
# plt.bar(x = x_data, height=y2, color = 'r' ,alpha=0.8, bottom=y1)
axes = plt.subplot(111)
axes.bar(x = x_data_recurs, height = r_std2, hatch='x', color='white', edgecolor='gray',bottom=r_std1, alpha=0.1)
for x, y in enumerate(r_std1):
plt.text(x-0.35, 0.6, '%s' % format(y,'.2%'), va='top',color = 'black',rotation=30)
plt.yticks([])
axes.spines['top'].set_visible(False)
axes.spines['right'].set_visible(False)
axes.spines['bottom'].set_visible(False)
axes.spines['left'].set_visible(False)
plt.xticks([0, 1, 2, 3, 4, 5, 6],['0-0.1','0.1-0.2','0.2-0.3','0.3-0.4','0.4-0.5','0.5-0.6','0.6-0.7'],rotation=30,fontproperties = 'Times New Roman', size = 14)
plt.show()
# #
# bin_range = [0,0.1,0.2,0.3,0.4,0.5,0.6,0.7]
# r_std[r_std>=0.7] = 0.7
# plt.hist(r_std, bins=bin_range, rwidth=0.5, align='left')
# plt.yticks(fontproperties = 'Times New Roman', size = 14)
# plt.xticks(fontproperties = 'Times New Roman', size = 14)
# plt.grid(axis='y', linestyle='--')
# plt.xticks([0,0.1,0.2,0.3,0.4,0.5,0.6],['0-0.1','0.1-0.2','0.2-0.3','0.3-0.4','0.4-0.5','0.5-0.6','>0.6'])
# pl.xticks(rotation=30)
# # plt.legend(r'$\sigma_{\sqrt{\mathrm{H}/\mathrm{W}}}$')
# plt.xlabel('(c) Sequence ratio variation distribution')
# plt.show()
# # #
# # #
if __name__ == '__main__':
data_path = './data.xls'
main(data_path)
import numpy as np
import matplotlib.pyplot as plt
import os.path as osp
import os
import glob
from PIL import Image
import matplotlib.pylab as pl
import seaborn as sns
def cam_seqlen(data_path):
num_ids_ge_2 = 0 # the number of tracklets that are captured by at least two cameras
num_imgs = 0 # the number of bounding boxes
cam_seq_len = {}
recurrents = []
img_areas, img_hs, img_ws, img_rs = [], [], [], []
seq_areas_std, seq_hs_std, seq_ws_std, seq_rs_std = [], [], [], []
id_paths = glob.glob(os.path.join(data_path, '*'))
for id_path in id_paths:
seq_id = id_path.split('/')[-1]
seq_paths = glob.glob(os.path.join(id_path, '*'))
recurrents.append(len(seq_paths))
if len(seq_paths) >= 2:
num_ids_ge_2 += 1
for seq_path in seq_paths:
seq_imgs_area, seq_imgs_h, seq_imgs_w, seq_imgs_r = [], [], [], []
lid, cid, vid = seq_path.split('/')[-1].split('_')
img_paths = glob.glob(os.path.join(seq_path, '*.png'))
# for img_path in img_paths:
# img = Image.open(img_path)
# width, height = img.size
# seq_imgs_area.append(width * height)
# seq_imgs_h.append(height)
# seq_imgs_w.append(width)
# seq_imgs_r.append(width/height)
# img_areas.extend(seq_imgs_area)
# img_hs.extend(seq_imgs_h)
# img_ws.extend(seq_imgs_w)
# img_rs.extend(seq_imgs_r)
# seq_areas_std.append(np.std(seq_imgs_area))
# seq_hs_std.append(np.std(seq_imgs_h))
# seq_ws_std.append(np.std(seq_imgs_w))
# seq_rs_std.append(np.std(seq_imgs_r))
seq_len = len(img_paths)
if lid in cam_seq_len.keys():
cam_seq_len[lid].append(seq_len)
else:
cam_seq_len[lid] = []
cam_seq_len[lid].append(seq_len)
plt.rc('font',family='Times New Roman')
# plt.hist(recurrents, bins=40)
# plt.show()
# for lid in cam_seq_len.keys():
# n2, bins2, patches2 = plt.hist([cam_seq_len['L02'], cam_seq_len['L04'], cam_seq_len['L01']], bins=25, histtype='bar', align='left')
# print(n2.shape, bins2.shape)
# fig = plt.figure()
# fig, ax = plt.subplots(1,1)
plt.hist([cam_seq_len['L01'], cam_seq_len['L02'], cam_seq_len['L04']], bins=15, histtype='bar', align='left', density=True, color=['r','blue','green'], alpha=0.3)
plt.yticks(size = 14)
plt.xticks(size = 14)
sns.kdeplot(cam_seq_len['L01'], shade=False, color='r', shade_lowest=True)
sns.kdeplot(cam_seq_len['L02'], shade=False, color='blue', shade_lowest=True)
sns.kdeplot(cam_seq_len['L04'], shade=False, color='green',shade_lowest=True)
# sns.distplot(cam_seq_len, x=['L02', 'L04', 'L01'], bins=25, kde=True)
# plt.xlabel(lid)
# plt.plot(bins2[:-1],n2[0],'--')
plt.legend(['Camear01','Camear02','Camera04'],loc = 0)
plt.grid(axis='y', linestyle='--')
plt.show()
# all_imgs = [img_areas, img_hs, img_ws, img_rs]
# all_imgs_label = ['a', 'h', 'w', 'r']
# all_seqs = [seq_areas_std, seq_hs_std, seq_ws_std, seq_rs_std]
# all_seqs_label = ['as', 'hs', 'ws', 'rs']
# for i, all_img in enumerate(all_imgs):
# plt.hist(all_img, bins=40)
# plt.xlabel(all_imgs_label[i])
# plt.show()
# for i, all_seq in enumerate(all_seqs):
# plt.hist(all_seq, bins=40)
# plt.xlabel(all_seqs_label[i])
# plt.show()
# print("The ids in VVReID is {}".format(num_ids_ge_2))
if __name__ == "__main__":
cam_seqlen('/run/user/1000/gvfs/smb-share:server=192.168.20.195,share=benchmark/download_dataset/VVReID_PaperVersion_NoMask/IDs')


 386
386

 被折叠的 条评论
为什么被折叠?
被折叠的 条评论
为什么被折叠?
 到【灌水乐园】发言


