


 本文介绍了一种使用K-means算法进行手写数字图片聚类的方法,通过调整聚类数量并评估轮廓系数,展示了不同聚类数下的数据分布及最佳聚类效果。
ML之K-means:基于(完整的)手写数字图片识别数据集利用K-means算法实现图片聚类
目录
输出结果
![]()
设计思路
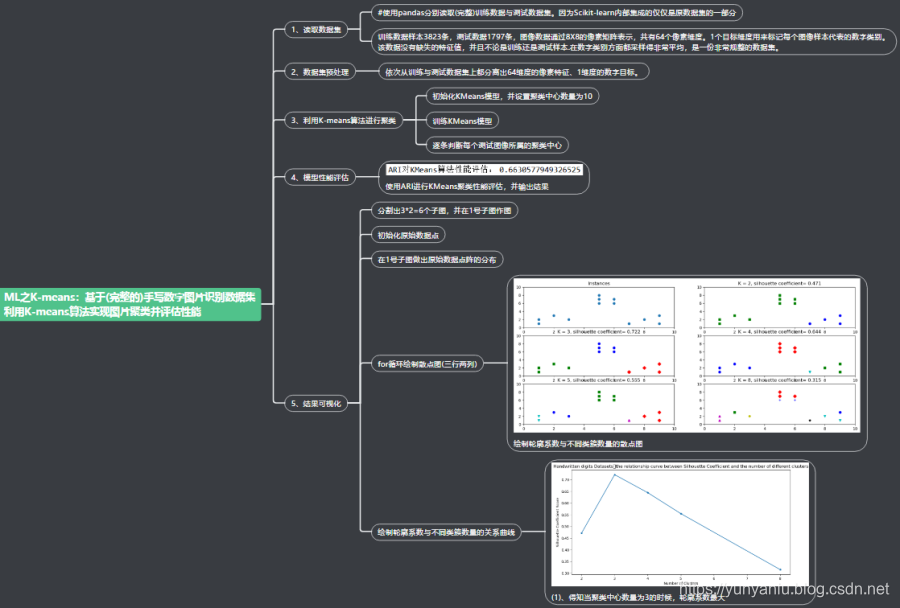
核心代码
metrics.adjusted_rand_score(y_test, y_pred)
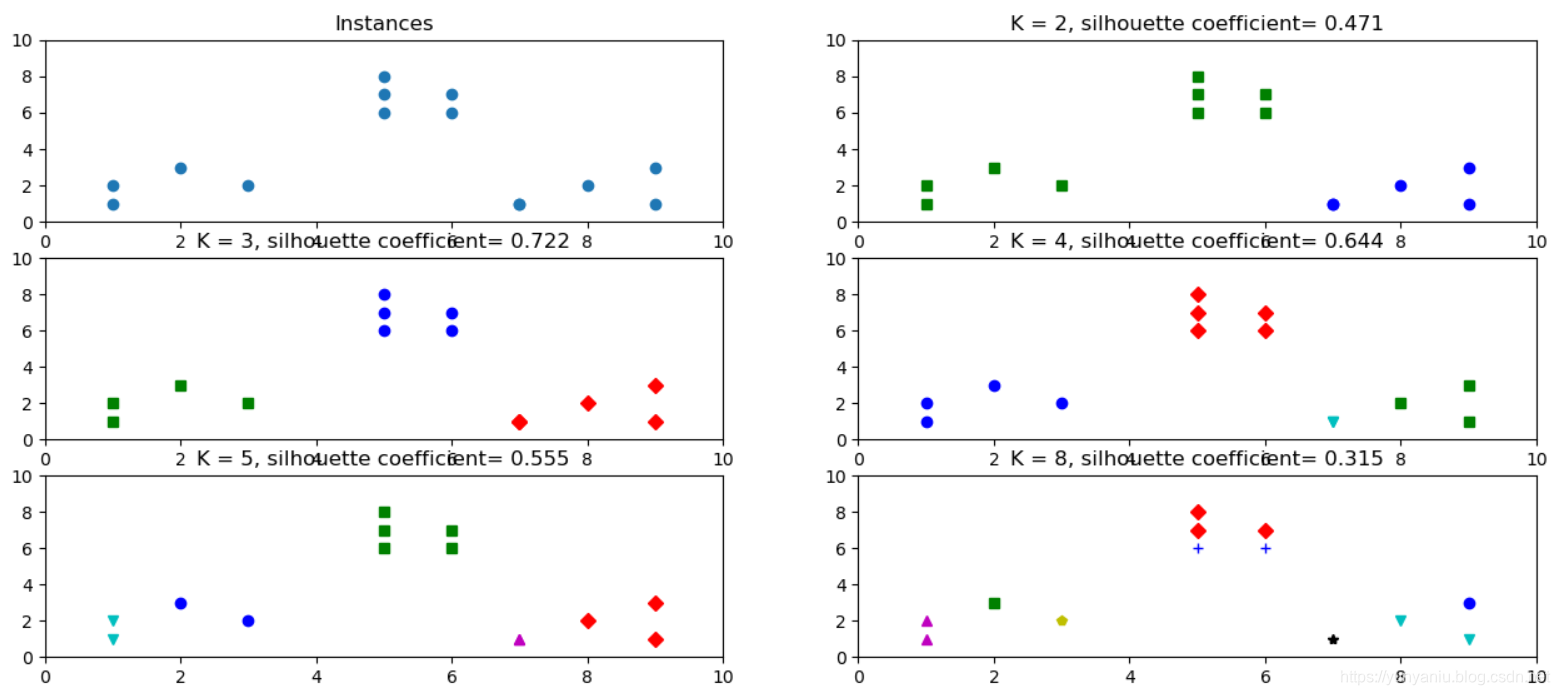
plt.xlim([0, 10])
plt.ylim([0, 10])
plt.title('Instances')
plt.scatter(x1, x2)
colors = ['b', 'g', 'r', 'c', 'm', 'y', 'k', 'b']
markers = ['o', 's', 'D', 'v', '^', 'p', '*', '+']
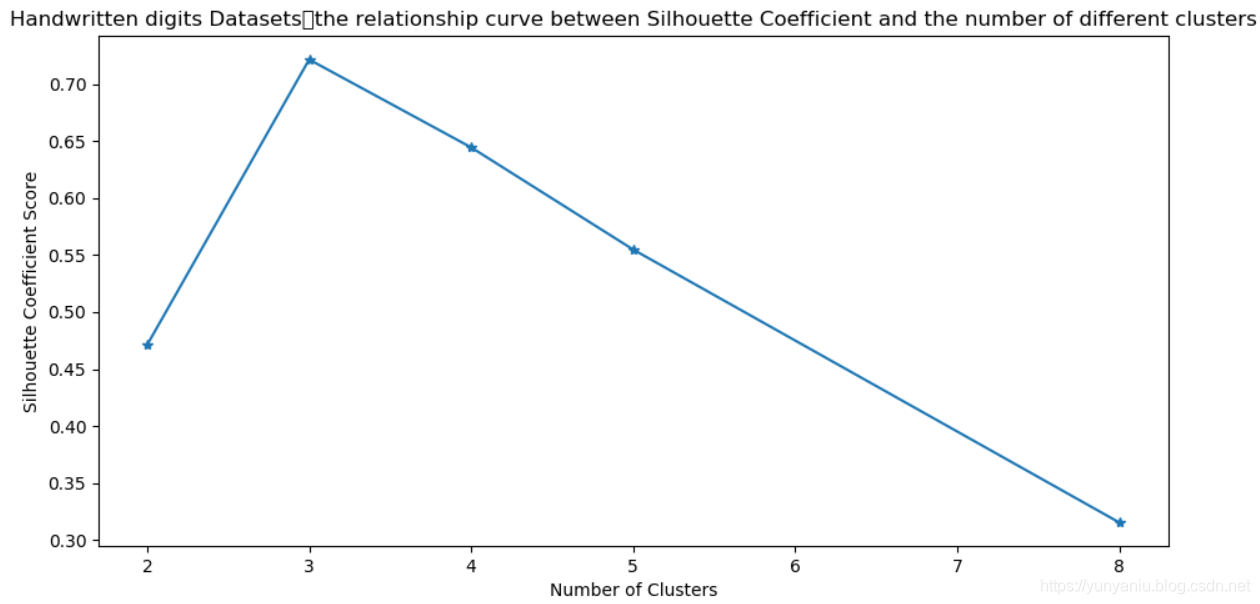
clusters = [2, 3, 4, 5, 8]
subplot_counter = 1
sc_scores = []
for t in clusters:
subplot_counter += 1
plt.subplot(3, 2, subplot_counter)
kmeans_model = KMeans(n_clusters=t).fit(X)
for i, l in enumerate(kmeans_model.labels_):
plt.plot(x1[i], x2[i], color=colors[l], marker=markers[l], ls='None')
plt.xlim([0, 10])
plt.ylim([0, 10])
sc_score = silhouette_score(X, kmeans_model.labels_, metric='euclidean')
sc_scores.append(sc_score)
plt.title('K = %s, silhouette coefficient= %0.03f' %(t, sc_score))
plt.figure()
plt.plot(clusters, sc_scores, '*-')
plt.xlabel('Number of Clusters')
plt.ylabel('Silhouette Coefficient Score')
plt.title('Handwritten digits Datasets:the relationship curve between Silhouette Coefficient and the number of different clusters')
plt.show()


 6805
6805

 被折叠的 条评论
为什么被折叠?
被折叠的 条评论
为什么被折叠?
 到【灌水乐园】发言


