


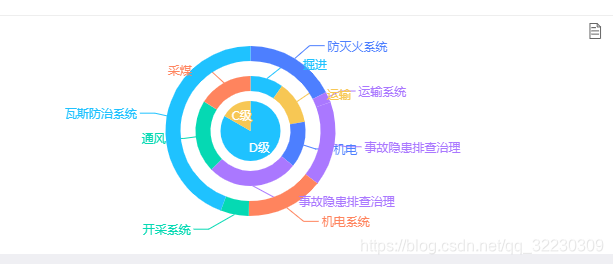
1 饼状图
示例图
前台代码html:
<div>
     <div id="yhzhfx"></div>
 </div>
前台代码js:
 var myChart = echarts.init(document.getElementById('yhzhfx'));
    option = {
        tooltip : {
            trigger: 'item',
            formatter: "{a} <br/>{b} : {c} ({d}%)"
        },
        toolbox: {
            show : true,
            feature : {
                mark : {show: true},
                dataView : {show: true, readOnly: false},
                magicType : {
                    show: true,
                    type: ['pie', 'funnel']
                },
                myTool1: {
                    show: true,
                    title: '导出',
                    onclick: function (){
                        alert('1')
                    }
                },
                saveAsImage : {show: true}
            }
        },
        calculable : false,
        series : [
            {
                name:'',
                type:'pie',
                selectedMode: 'single',
                radius : [0, 30],
                x: '20%',
                width: '30%',
                funnelAlign: 'right',
                max: 1548,
                itemStyle : {
                    normal : {
                        label : {
                            position : 'inner'
                        },
                        labelLine : {
                            show : false
                        }
                    }
                },
                color:['#1FC2FF','#F7C754'],
                data:[]
            },
            {
                name:'',
                type:'pie',
                radius : [40, 55],
                x: '30%',
                width: '20%',
                funnelAlign: 'left',
                max: 1048,
                color:['#1FC2FF','#F7C754','#4D7FFF','#AA78FF','#05D9B3','#FF845E'],
                data:[]
            },
            {
                name:'',
                type:'pie',
                radius : [70, 85],
                x: '30%',
                width: '20%',
                funnelAlign: 'left',
                max: 1048,
                color:['#4D7FFF','#AA78FF','#FF845E','#05D9B3','#1FC2FF'],
                data:[
                ]
            }
        ]
    };
    myChart.showLoading();    //数据加载完之前先显示一段简单的loading动画
    $.ajax({
   			 //这里需要三个res数组来装三个饼状环数据,在data使用function()进行遍历后台传来的值装入每个res数组中
        url: "xxx/yhpczlWtyhzhfx",
        success: function(data){
            var res=[];
            var item=data.list1;
            var res1=[];
            var item1=data.list2;
            var res2=[];
            var item2=data.list3;
            myChart.hideLoading();    //隐藏加载动画
            myChart.setOption({        //加载数据图表
                tooltip : {
                    trigger: 'item',
                    formatter: "{a} <br/>{b} : {c} ({d}%)"
                },
                toolbox: {
                    show : true,
                    feature : {
                        mark : {show: true},
                        dataView : {show: true, readOnly: false},
                        magicType : {
                            show: true,
                            type: ['pie', 'funnel']
                        },
                        myTool1: {
                            show: true,
                            title: '导出',
                            onclick: function (){
                                alert('1')
                            }
                        },
                        saveAsImage : {show: true}
                    }
                },
                calculable : false,
                series : [
                    {
                        name:'',
                        type:'pie',
                        selectedMode: 'single',
                        radius : [0, 30],
                        x: '20%',
                        width: '30%',
                        funnelAlign: 'right',
                        max: 1548,
                        itemStyle : {
                            normal : {
                                label : {
                                    position : 'inner'
                                },
                                labelLine : {
                                    show : false
                                }
                            }
                        },
                        color:['#1FC2FF','#F7C754'],
                        data:function () {
                            for(var i=0;i<item.length;i++){
                                res.push({
                                    name:item[i].name,
                                    value:item[i].value
                                });
                            }
                            return res;
                        }()
                    },
                    {
                        name:'',
                        type:'pie',
                        radius : [40, 55],
                        x: '30%',
                        width: '20%',
                        funnelAlign: 'left',
                        max: 1048,
                        color:['#1FC2FF','#F7C754','#4D7FFF','#AA78FF','#05D9B3','#FF845E'],
                        data:function () {
                            for(var i=0;i<item1.length;i++){
                                res1.push({
                                    name:item1[i].name,
                                    value:item1[i].value
                                });
                            }
                            return res1;
                        }()
                    },
                    {
                        name:'',
                        type:'pie',
                        radius : [70, 85],
                        x: '30%',
                        width: '20%',
                        funnelAlign: 'left',
                        max: 1048,
                        color:['#4D7FFF','#AA78FF','#FF845E','#05D9B3','#1FC2FF'],
                        data:function () {
                            for(var i=0;i<item2.length;i++){
                                res2.push({
                                    name:item2[i].name,
                                    value:item2[i].value
 最低0.47元/天 解锁文章


 1775
1775

 被折叠的 条评论
为什么被折叠?
被折叠的 条评论
为什么被折叠?
 到【灌水乐园】发言


