


练习七:k均值聚类与主成分分析
目录:
1.包含的文件。
2.k均值聚类。
3.(PCA)主成成分分析。
1.包含的文件。
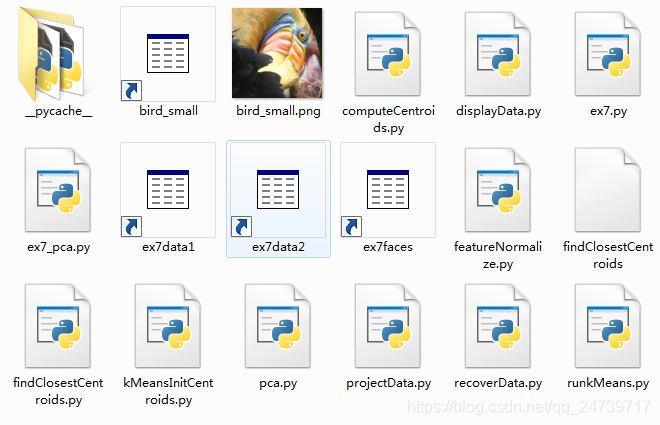
| 文件名 | 含义 |
| ex7.py | K-means实验 |
| ex7_pca.py | PCA实验 |
| ex7data1.mat | PCA实验数据集 |
| ex7data2.mat | K-means实验数据集 |
| ex7faces.mat | 人脸数据集 |
| bird_small.png | 示例图片(鸟) |
| displayData.py | 数据可视化 |
| runkMeans.py | K-means算法 |
| featureNormalize.py | 特征归一化 |
| projectData.py | 原始数据从高维空间映射到低维空间 |
| recoverData.py | 将压缩数据恢复到原始数据 |
| findClosestCentroids.py | 找到最近的簇 |
| computeCentroids.py | 更新聚类中心 |
| kMeansInitCentroids.py | 初始化k-means的聚类中心 |
| pca.py | PCA算法 |
注:红色部分需要自己填写。
2.K均值聚类
- 导入需要的包以及初始化:
import matplotlib.pyplot as plt
import numpy as np
import scipy.io as scio
from skimage import io
from skimage import img_as_float

import runkMeans as km
import findClosestCentroids as fc
import computeCentroids as cc
import kMeansInitCentroids as kmic

plt.ion()
np.set_printoptions(formatter={'float': '{: 0.6f}'.format})
2.1实现K-means
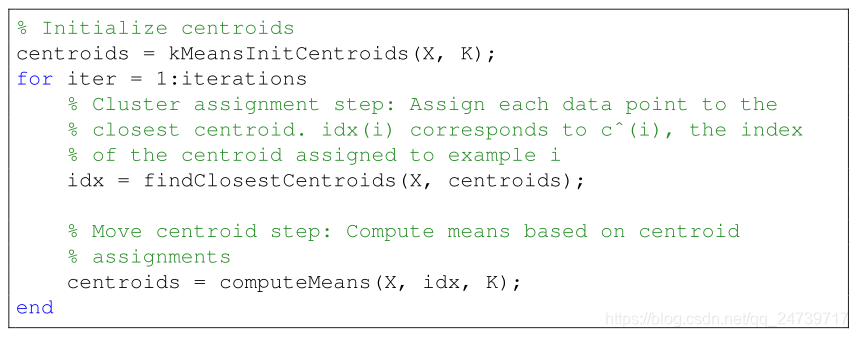
- K-means算法流程:
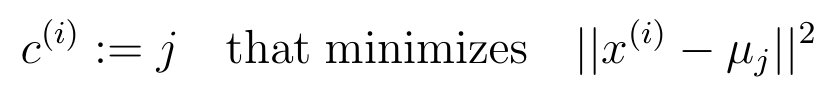
- 找到最近的簇中心:
- 编写簇中心寻找程序findClosestCentroids.py:
import numpy as np


def find_closest_centroids(X, centroids):
    # Set K
    K = centroids.shape[0]#聚类中心数量

    m = X.shape[0]#样本数

    # You need to return the following variables correctly.
    idx = np.zeros(m)

    # ===================== Your Code Here =====================
    # Instructions : Go over every example, find its closest centroid, and store
    #                the index inside idx at the appropriate location.
    #                Concretely, idx[i] should contain the index of the centroid
    #                closest to example i. Hence, it should be a value in the
    #                range 0..k
    #
    distance = np.zeros((m,K))
    for i in range(m):#遍历样本
        for j in range(K):#遍历簇中心
            center = centroids[j]
            d = (X[i] - center) * (X[i] - center)
            distance[i, j] = d.sum()

    idx = np.argmin(distance, axis = 1)#返回聚类中心最近的中心的id

    # ==========================================================

    return idx
- 测试代码:
# ===================== Part 1: Find Closest Centroids =====================
# To help you implement K-means, we have divided the learning algorithm
# into two functions -- find_closest_centroids and compute_centroids. In this
# part, you should complete the code in the findClosestCentroids.py
#

print('Finding closest centroids.')

# Load an example dataset that we will be using
data = scio.loadmat('ex7data2.mat')
X = data['X']

# Select an initial set of centroids
k = 3  # Three centroids
initial_centroids = np.array([[3, 3], [6, 2], [8, 5]])

# Find the closest centroids for the examples using the
# initial_centroids
idx = fc.find_closest_centroids(X, initial_centroids)

print('Closest centroids for the first 3 examples: ')
print('{}'.format(idx[0:3]))
print('(the closest centroids should be 0, 2, 1 respectively)')

input('Program paused. Press ENTER to continue')- 测试结果:
Finding closest centroids.
Closest centroids for the first 3 examples:
[0 2 1]
(the closest centroids should be 0, 2, 1 respectively)
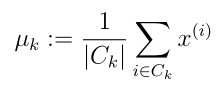
2.2计算均值
- 计算(更新)簇类中心(均值):
- 编写代码computeCentroids.py:
 最低0.47元/天 解锁文章


 1699
1699

 被折叠的 条评论
为什么被折叠?
被折叠的 条评论
为什么被折叠?
 到【灌水乐园】发言


