


作者自我介绍:大爽歌, b站小UP主 ,直播编程+红警三 ,python1对1辅导老师 。
本博客为一对一辅导学生python代码的教案, 获得学生允许公开。
具体辅导内容为《Computational Problems for Physics With Guided Solutions Using Python》,第一章(Chapter 1 Computational Basics for Physics)的 Code Listings
由于代码较多,第一章内容分为三部分
A(1.1 - 1.6)
B(1.7 - 1.11)
C(1.12 - 1.17)
0 安装第三方库
已安装
- numpy
- matplotlib
待安装
- vpython
- pylab (a tool from matplotlib)
- mpl_toolkits (a tool from matplotlib)
- visual (unknown)
pip install VPython -i https://pypi.tuna.tsinghua.edu.cn/simple
pip install matplotlib -i https://pypi.tuna.tsinghua.edu.cn/simple
参考书(链接):
https://www.glowscript.org/docs/VPythonDocs/graph.html
1 - vpython graph
uses VPython to produce the two plots in Figure 1.1.
- graph
a graph is inherently 2D and contains graphing objects for displaying curves, dots, and vertical or horizontal bars.
粗略中文理解,一片2D区域,展示graphing objects,像画板一样
如果不设置graph, 代码里面的图会绘制到vpython的默认初始graph(自带的)中
设置了graph后,代码里面的图会绘制到它最近的上面的那个graph中
以下展示了两个graph对象
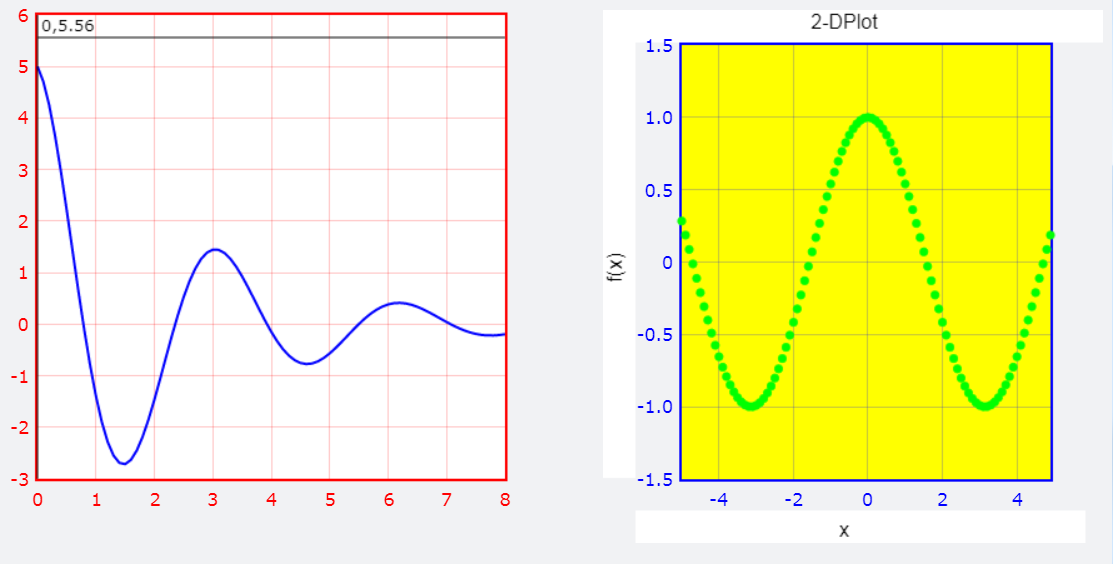
生成该图的代码如下
from vpython import *  # EasyVisualVP.py


graph1=graph(align='left',width=400,height=400, background=color.white,foreground=color.red)

Plot1=gcurve(color=color.blue)  # gcurve method
for x in arange(0,8.1,0.1):  # xrange
    Plot1.plot(pos=(x,5*cos(2*x)*exp(-0.4*x)))

graph2=graph(align='right',width=400,height=400,
             background=color.yellow,foreground=color.blue,
             title='2-DPlot',xtitle='x',ytitle='f(x)')

Plot2=gdots(color=color.green)  # Dots
for x in arange(-5,5,0.1):
    Plot2.plot(pos=(x,cos(x)))  # plotdots
我们提取出上面代码中,生成两个graph对象的生成代码来观察下
graph1=graph(align='left', width=400, height=400,
             background=color.white, foreground=color.red)
graph2=graph(align='right',width=400, height=400,
             background=color.yellow, foreground=color.blue,
             title='2-DPlot', xtitle='x', ytitle='f(x)')
graph是一个class, 创建graph对象代码中的参数意思
- align 对齐方式 只能是以下三个值之一
'left','right', or'none'(the default). - width 宽度
- height 高度
- background 背景色
- foreground 前景色(方框和xy轴的刻度颜色)
- title 图标题
- xtitle x轴的标题
- ytitle y轴的标题
参数拓展(上面只展示了graph刚才用的的参数,graph所有参数如下)
# from vpython.py :2253
scalarAttributes = ['width', 'height', 'title', 'xtitle', 'ytitle','align',
'xmin', 'xmax', 'ymin', 'ymax', 'logx', 'logy', 'fast', 'scroll']
2 - vpython graph plotting objects
- gcurve: a connected curve 连通的曲线
- gdots: disconnected dots 散点
- gvbars: vertical bars 垂直条
- ghbars: horizontal bars 水平条
使用对应的方法,将会根据设置的样式生成具有该样式的plotting
比如Plot1=gcurve(color=color.blue)就会生成一个颜色为蓝色的连通的曲线gcurve。
这个时候曲线上是没有内容的,即没有点。
比如运行以下两行代码,会生成一个空白页面(因为没有内容)
from vpython import *  # Import Vpython
Plot1=gcurve(color=color.blue)
给这个曲线加点的方法如下(简单写法,这个里面参数可能还有可以拓展说明的,具体后面遇到再说)
Plot1.plot(pos=(x,y))
一般会使用循环来添加,例如for x in arange(start, end, step)。
其中arange, 是来自numpy的函数。
这个函数比range好,因为支持float浮点数(range不支持)。
这里展示下上面四种类型的plotting objects的效果,如下
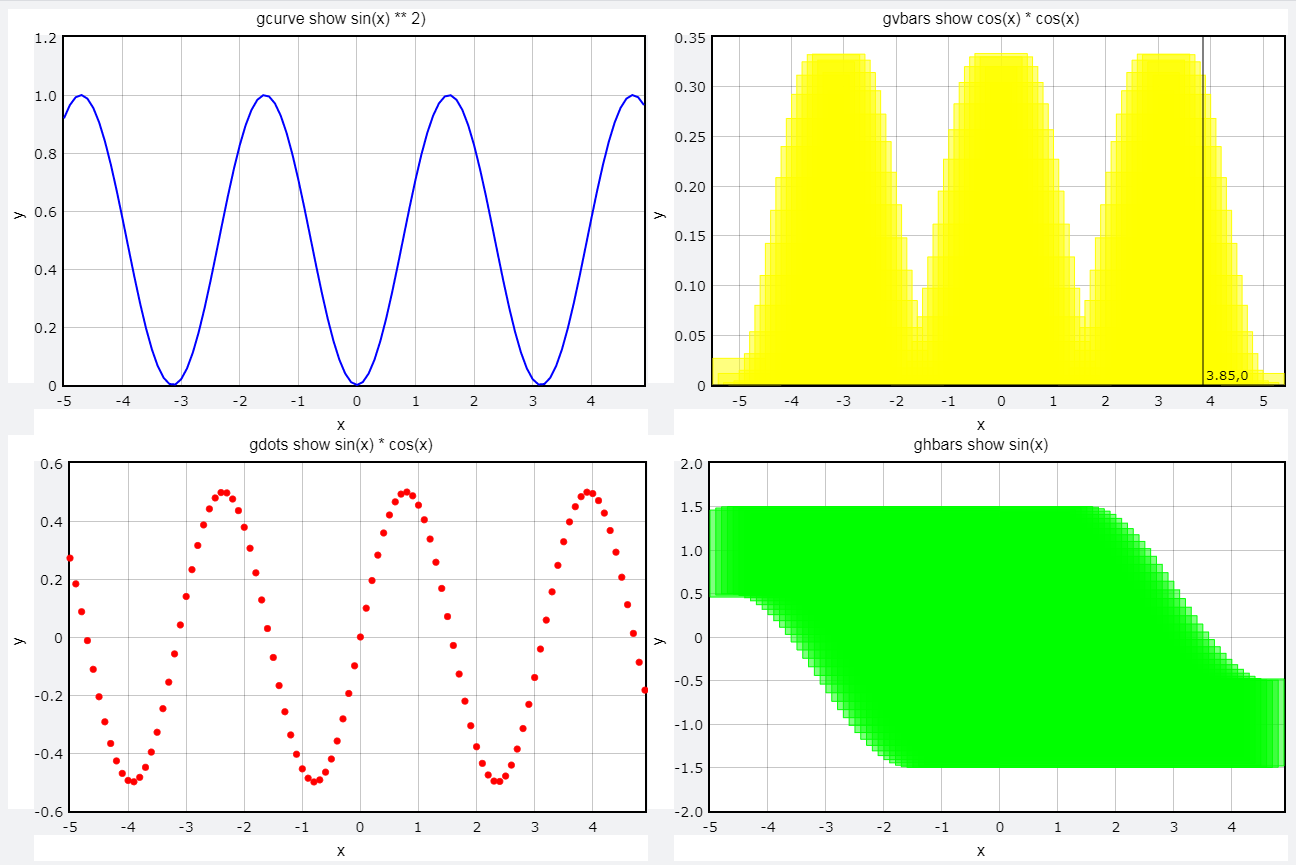
对应代码为
from vpython import *  # changed from 3GraphVP.py

graph(align='left', title="gcurve show sin(x) ** 2)", xtitle='x', ytitle='y', background=color.white, foreground=color.black)
y1 = gcurve(color=color.blue)
for x in arange(-5, 5, 0.1):
    y1.plot(pos=(x, sin(x) ** 2))

graph(align='left',title="gvbars show cos(x) * cos(x)", xtitle='x', ytitle='y', background=color.white, foreground=color.black)
y2 = gvbars(color=color.yellow)

for x in arange(-5, 5, 0.1):
    y2.plot(pos=(x, cos(x) * cos(x) / 3.))

graph(align='left',title="gdots show sin(x) * cos(x)", xtitle='x', ytitle='y', background=color.white, foreground=color.black)
y3 = gdots(color=color.red)

for x in arange(-5, 5, 0.1):
    y3.plot(pos=(x, sin(x) * cos(x)))

graph(align='left',title="ghbars show sin(x)", xtitle='x', ytitle='y', background=color.white, foreground=color.black)
y4 = ghbars(color=color.green)

for x in arange(-5, 5, 0.1):
    y4.plot(pos=(x, sin(x)))
3 - vpython 中的一些其他常用变量
color
颜色,包含以下几个值
black、white、red、green、blue、
yellow、cyan、magenta、orange、purple
其他包(Package)
vpython里面包含了其他包, 比如numpy,所以上面的代码才可以直接写arange, sin等函数。
这里展示下包含的常用包方法
math.*
包含sin, cos等等numpy.arangerandom.random
4 - numpy array
The array object in NumPy is called ndarray.
可以用列表创建,也常用np.arange(Xmin, Xmax, DelX)方法来创建
数组很像列表,但比里列表强大,强在支持各种运算
比如下面的
import numpy as np  # a part from EasyMatPlot.py


Xmin = -5.;    Xmax = +5.;    Npoints = 20
DelX = (Xmax - Xmin) / Npoints

x = np.arange(Xmin, Xmax, DelX)
y = np.sin(x) * np.sin(x*x)
print(x)
# [-5.  -4.5 -4.  -3.5 -3.  -2.5 -2.  -1.5 -1.  -0.5  0.   0.5  1.   1.5
# 2.   2.5  3.   3.5  4.   4.5]
print(y)
# [-0.12691531  0.96338048 -0.21788595 -0.10913545 -0.05815816  0.01985684
#   0.68815856 -0.77612411 -0.70807342 -0.11861178  0.          0.11861178
#   0.70807342  0.77612411 -0.68815856 -0.01985684  0.05815816  0.10913545
#   0.21788595 -0.96338048]
注意:numpy中也有sin、cos方法,
但是和math中的sin、cos方法不同,numpy中的支持数组运算。
pylab 对 numpy 的调用
pylab 中,对numpy进行了两次重要调用如下
from numpy import *
import numpy as np
所以在导入了pylab的代码中,使用np.arange和arange都是可以的。
需要注意的一点事,此时使用sin和cos等,都是来自numpy的支持数组运算的。
5 - 1.3 EasyMatPlot.py
1 占位符
详细文档:python 格式化输出详解 上篇
占位符格式
”%s“ % variable一个”%s %s %s“ % (a, b, c)多个
具体到EasyMatPlot.py的代码中的
”%8.2f“ % x[0]的%8.2f
- 8是width,占位符总宽度(字符、数字个数)
- .2 是精度设置,代表精度为2, 可以理解为保留2位小数
- f 代表格式为浮点数
运行效果如下
y = [196338.048,-0.12691531,-78.8595,-581581.6]
print("%8.2f,%8.2f,%8.2f,%8.2f" % tuple(y))
# 196338.05,   -0.13,  -78.86,-581581.60
2 EasyMatPlot 绘制效果
其代码如下
from pylab import *  # EasyMatPlot.py

Xmin = -5. ;  Xmax = +5. ;  Npoints = 500
DelX = (Xmax - Xmin) / Npoints

x = arange(Xmin, Xmax, DelX)
y = sin(x) * sin(x*x)

print("arange => x[0], x[1], x[499] = %8.2f %8.2f %8.2f" %(x[0], x[1], x[499]))
print("arange => y[0], y[1], y[499] = %8.2f %8.2f %8.2f" %(y[0], y[1], y[499]))

print("\n Doing plotting, look for Figure 1")

xlabel('x') ;  ylabel('f(x)') ;  title('f(x)vsx')
text(1.75, 0.75, 'MatPlotLib \n Example')
plot(x, y, '-', lw=2)
grid(True)
show()
绘制效果如图
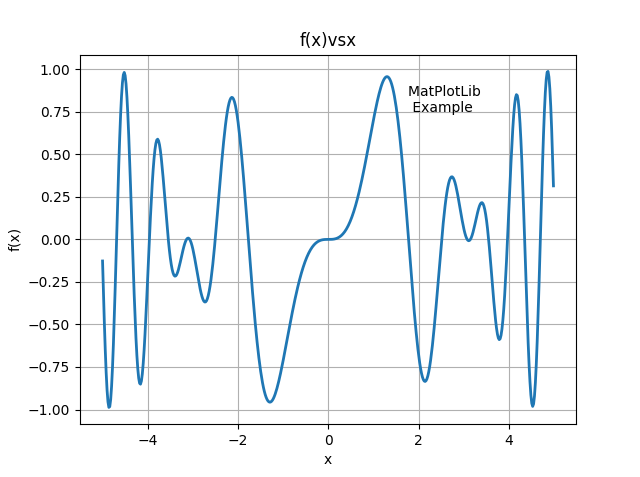
后半部分代码说明见下文(即第六部分)
6 - matplotlib
pylab中导入了 matplotlib 。
EasyMatPlot.py最后五行的代码使用的方法其实都是matplotlib.pyplot的方法
一般matplotlib都会导入pyplot为plt
1 函数简单介绍
-
xlabel设置x轴文本 -
ylabel设置y轴文本 -
title设置图表标题 -
grid是否展示网格 -
show展示图表 -
text(x, y, s)在图上坐标为(x,y)的地方展示文本s。
2 plot
详细文档: matplotlib.pyplot.plot
plot函数比较复杂,其详细参数格式如下
matplotlib.pyplot.plot(*args, scalex=True, scaley=True, data=None, **kwargs)
这里我们做一个简化的介绍,介绍一些常见的写法(可能还会有其他写法,遇到再说)
EasyMatPlot.py中的写法plot(x, y, '-', lw=2),是一种比较常见的写法
plot([x], y, [fmt], *, data=None, **kwargs)
plot([x], y, [fmt], [x2], y2, [fmt2], ..., **kwargs)
其中
- x 横坐标组成的列表(或数组),
- y 纵坐标组成的列表(或数组)
- fmt 定义基本格式(如颜色、标记和线型),
EasyMatPlot.py中的’-'代表线型为实线
fmt 只是快速设置基本属性的缩写。所有这些以及更多的都可以由关键字
kwargs参数控制。
fmt 详细格式为[marker][line][color]
| 说明 | 值举例 | |
|---|---|---|
marker | 标记(点的样式) | '.'、','、'o'、'v'、'^'、'<'、'>'、'1'、'2'、'3'、'4' |
line | 线的样式 | '-'、'--'、'-.'、':' |
color | 颜色 | 'r'、'g'、'b'、'c'、'm'、'y'、'k'、'w' |
将EasyMatPlot.py中绘图时的fmt设置为'o--r',
效果如下图(标记点为圆点,线为虚线,颜色为color).
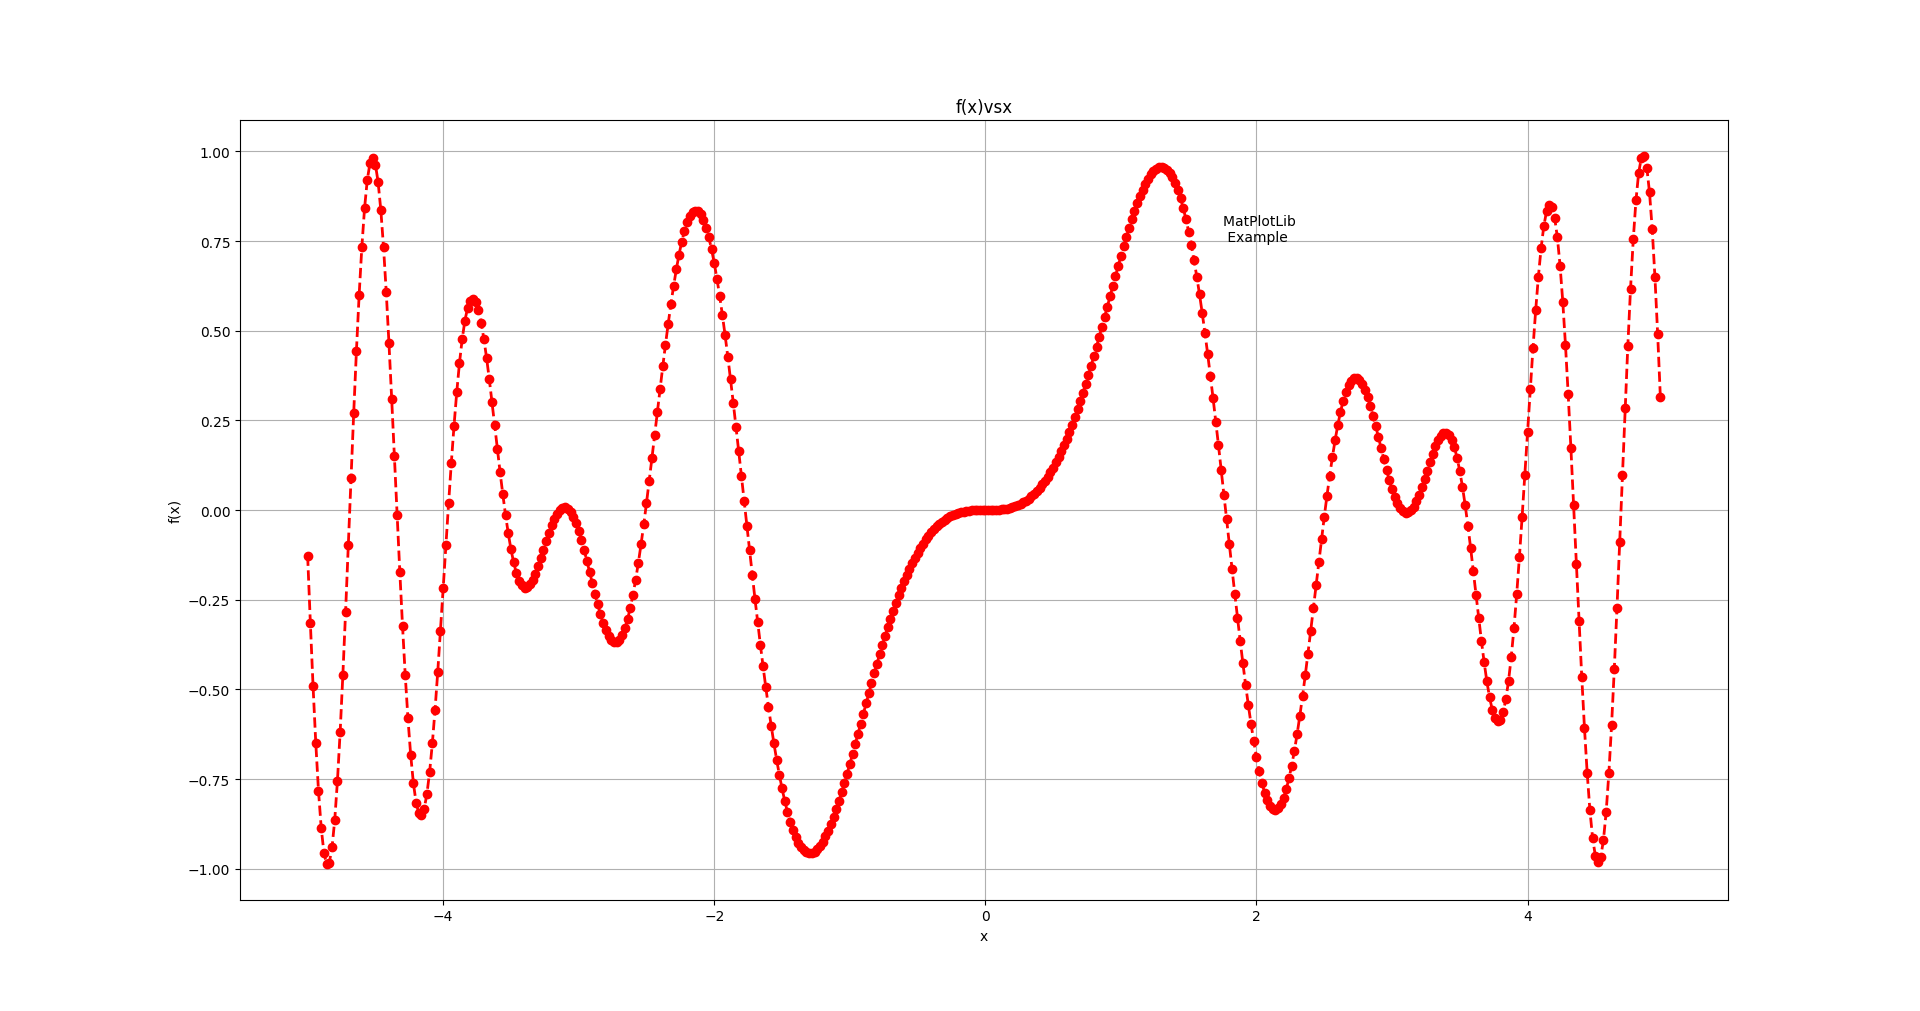
marker、line、color都是可选的,都不指定的话使用使用样式循环style cycle中的值
两点说明:
不指定marker的话,不展示点。
指定了marker不指定line的话,不展示线。
这个特性可以用来分别指定线和点。
fmt设置为'^b'
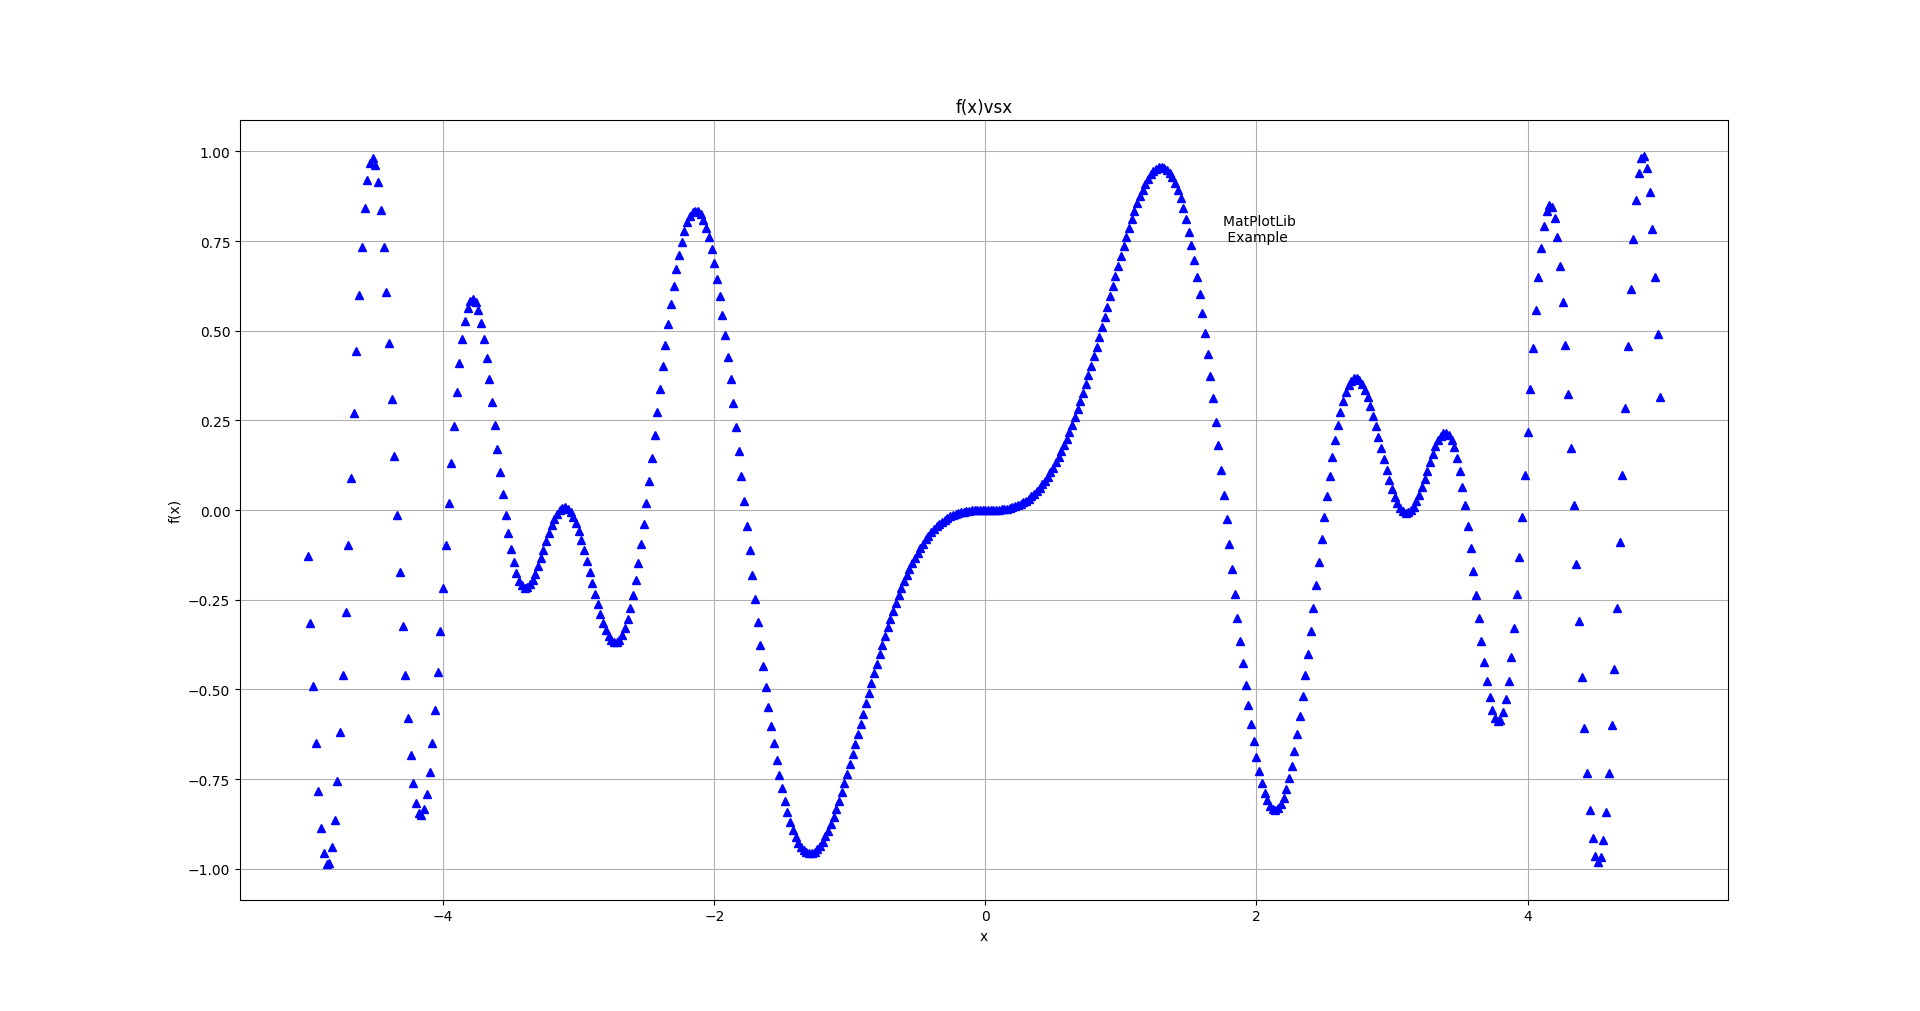
fmt设置为'-.g'
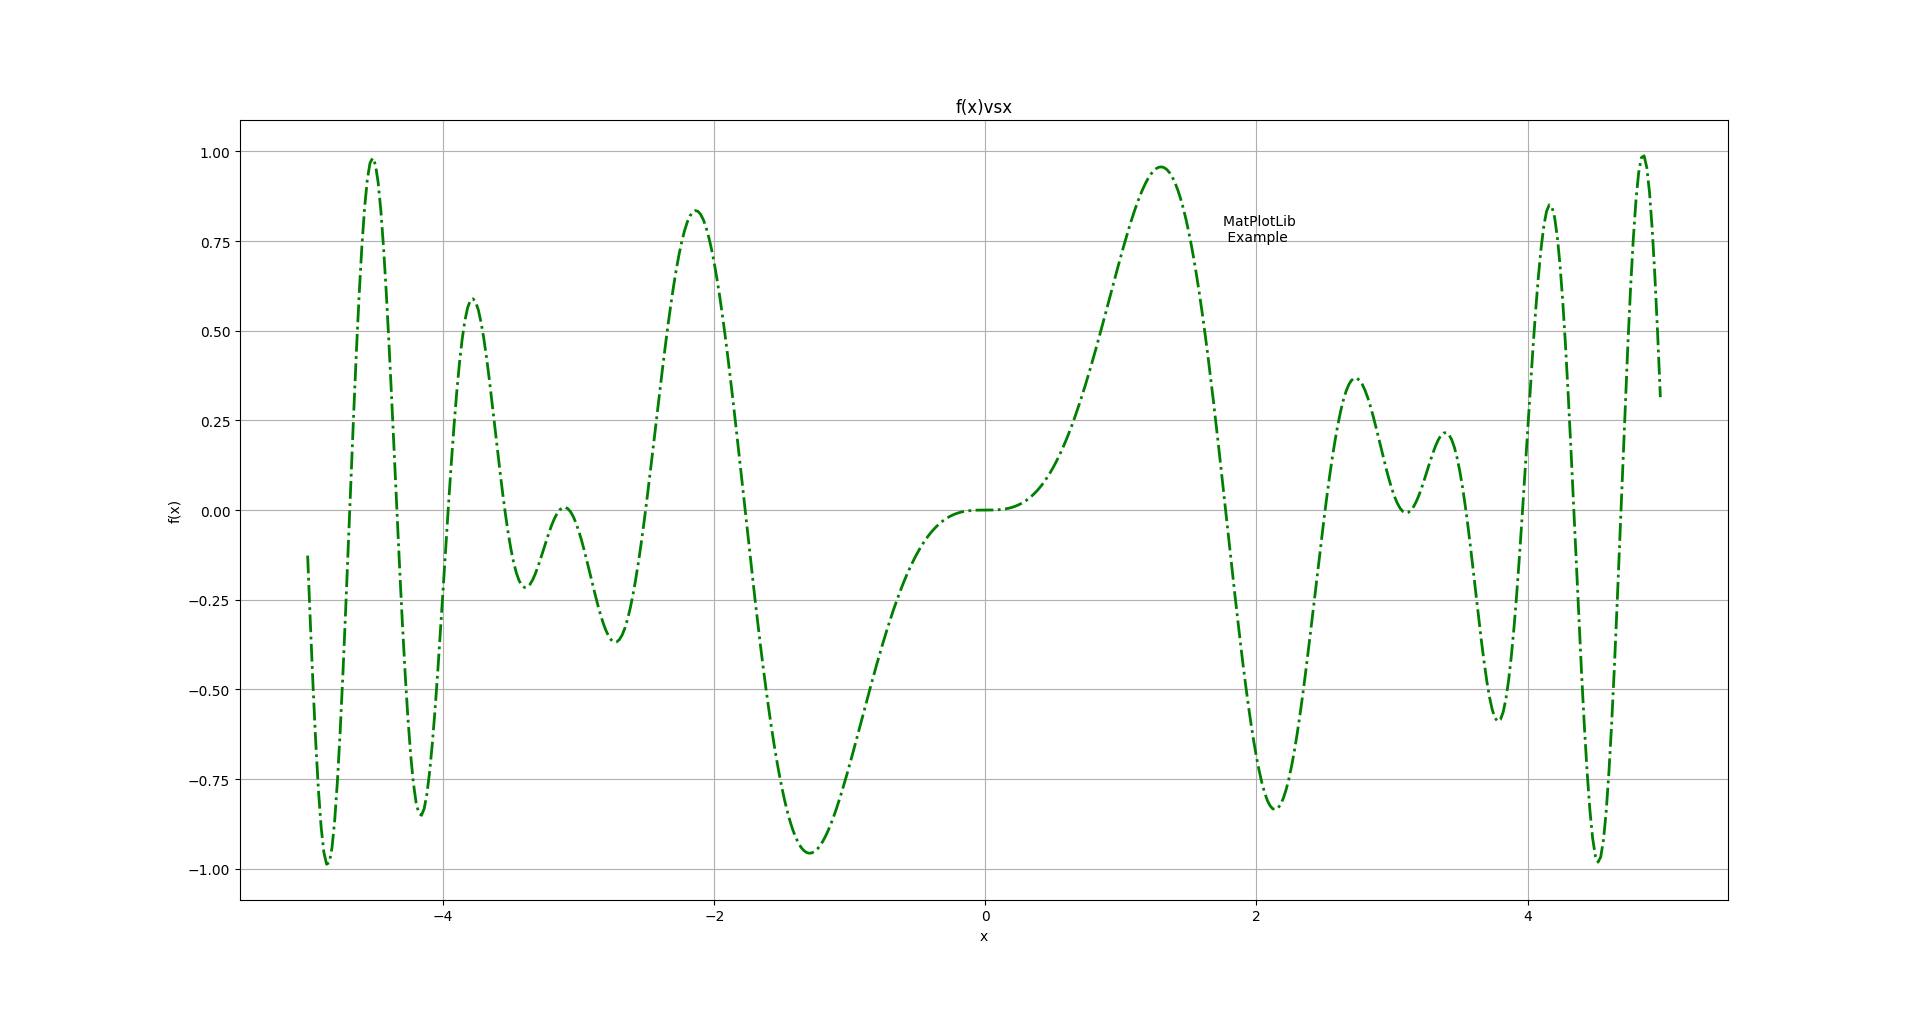
详细参数说明见官方文档
中的fmt部分
- kwargs 设置一些keyword参数,
EasyMatPlot.py中的lw=2代表线宽设置为2,等价于(linewidth=2)
详细参数说明见官方文档
中的kwargs部分
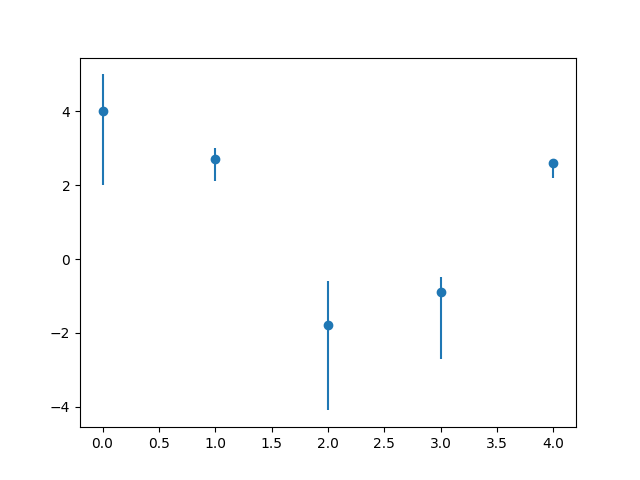
3 errorbar
Plot y versus x as lines and/or markers with attached errorbars.
from errorbar
具体效果为,在指定点绘制误差线(x轴或者y轴)
参数过多,简单写法为
matplotlib.pyplot.errorbar(x, y, yerr=None, xerr=None, fmt='', **kwargs)
yerr: 指定平行于y轴的误差线范围(长度)
xerr: 指定平行于x轴的误差线范围(长度)
其值格式相同,支持
- scalar(a float): 对称加减值
- shape(N,): 一维数组(N和x,y的N相同),对称加减值
- shape(2, N): 二维数组(N和x,y的N相同), 分别指定加减值。
Separate - and + values for each bar. First row contains the lower errors, the second row contains the upper errors. - None: No errorbar.
import pylab as p
from numpy import *

x1 = arange(0, 5, 1)                    # Data set 1 points
y1 = array([4.0, 2.7, -1.8, -0.9, 2.6])
errTop = array([1.0, 0.3, 1.2, 0.4, 0.1]) # Asymm errors
errBot = array([2.0, 0.6, 2.3, 1.8, 0.4])
p.errorbar(x1, y1, [errBot, errTop], fmt = 'o') # Error bars

p.show()
效果如下图
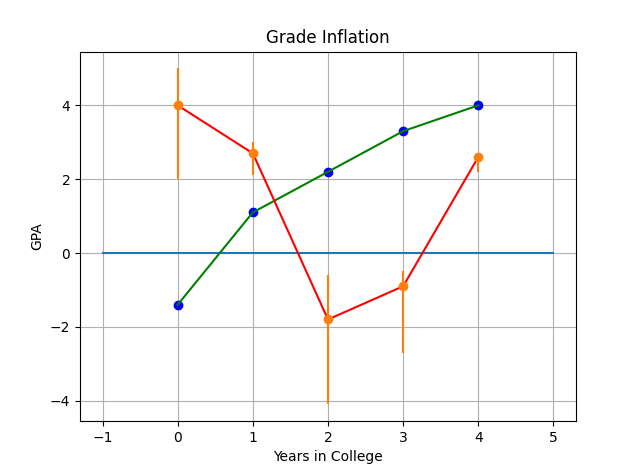
7 - 1.4 GradesMatPlot.py
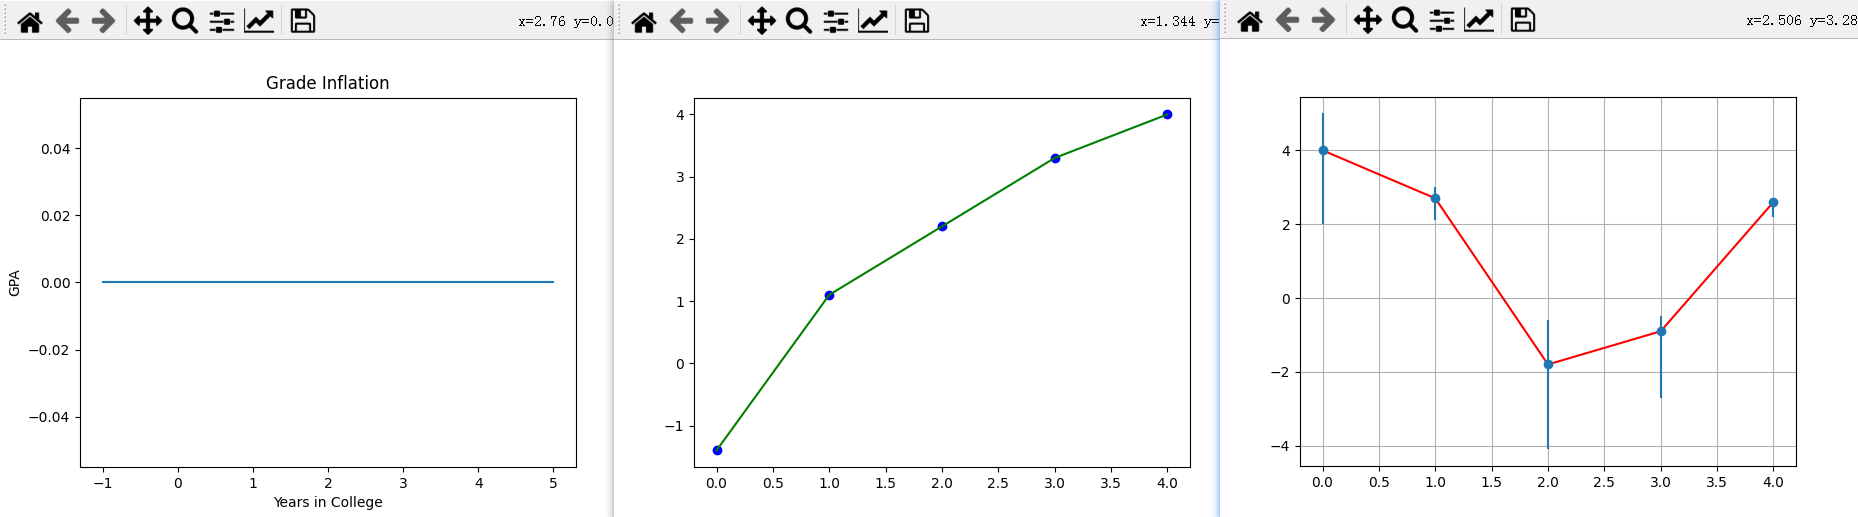
GradesMatPlot一张图里面绘了很多线,多了就乱,乱了就容易分不清哪个图是哪个代码产生的。
所以对代码分段,图分别绘制(中间show一次就是绘制了一次),
即代码如下
import pylab as p                           # Matplotlib
from numpy import *

p.title('Grade Inflation')           # Title and labels
p.xlabel('Years in College')
p.ylabel('GPA')
xa = array([-1, 5])                  # For horizontal line
ya = array([0, 0])
p.plot(xa, ya)                       # Draw horizontal line
p.show()   # draw 1


x0 = array([0, 1, 2, 3, 4])            # Data set 0 points
y0 = array([-1.4, +1.1, 2.2, 3.3, 4.0])
p.plot(x0, y0, 'bo')            # Data set 0 = blue circles
p.plot(x0, y0, 'g')                     # Data set 0 = line
p.show()  # draw 2


x1 = arange(0, 5, 1)                    # Data set 1 points
y1 = array([4.0, 2.7, -1.8, -0.9, 2.6])
p.plot(x1, y1, 'r')
errTop = array([1.0, 0.3, 1.2, 0.4, 0.1]) # Asymm errors
errBot = array([2.0, 0.6, 2.3, 1.8, 0.4])
p.errorbar(x1, y1, [errBot, errTop], fmt = 'o') # Error bars
p.grid(True)                                    # Grid line
p.show()  # draw 3
三次绘制效果如下图
GradesMatPlot.py中三图一起绘制,就是叠在一起,如下图
8 - 1.5 MatPlot2figs.py
1 figure
创建一个新的图形(窗口),或者激活一个现有的图形,
返回一个matplotlib.figure.Figure对象,返回值有时会用到。
简单使用方法:
matplotlib.pyplot.figure(num=None)
num: 图形的唯一标识符,可以为数字(int)和字符串(string)。
如果具有该标识符的图形已经存在,则此图形将被激活并返回。
如果没有,就创建一个新的图形(窗口)。
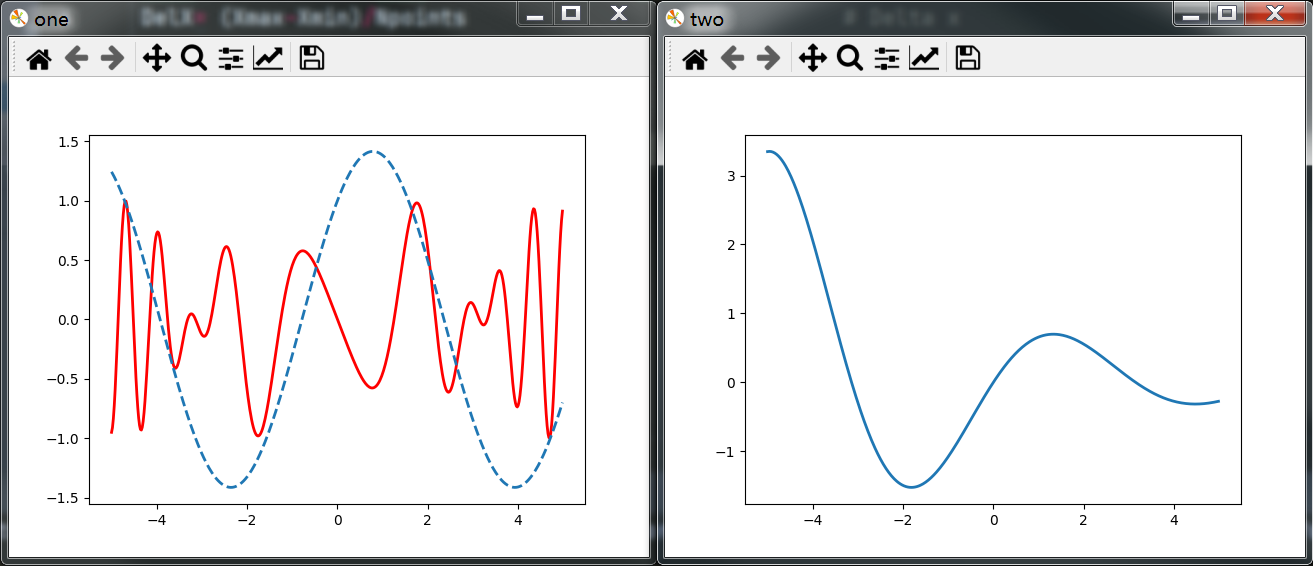
这里举一个代码的例子如下:
from pylab import *  # Simplified from MatPlot2figs.py

Xmin = -5.0;      Xmax =  5.0;        Npoints= 500
DelX= (Xmax-Xmin)/Npoints                             # Delta x
x1 = arange(Xmin, Xmax, DelX)                        # x1 range
y1 = -sin(x1)*cos(x1*x1)                           # Function 1
y2 = exp(-x1/4.)*sin(x1)
y3 = sin(x1) + cos(x1)

figure("one")
plot(x1, y1, 'r', lw=2)

figure("two")
plot(x1, y2, '-', lw=2)

figure("one")
plot(x1, y3, '--', lw=2)

show()
运行后效果如下(会同时打开两个窗口,后面的会挡住前面的,移动一下就好)
补充:
上面代码中的exp函数是numpy中的,
np.exp(x)代表计算e的x次方,
如果x是数组,则针对数组中的元素计算,生成新的数组。
2 subplot
作用: 在当前图形figure上添加一个子图(划分出一个区域绘制子图)。
简单使用方法为subplot(nrows, ncols, index, **kwargs)
将figure划分为nrows行、ncols列个子图区域(此时每个区域内什么都没有),
在第index个区域创建子图并进行绘制(此时会在子图内绘制出初始坐标轴)。
index计算顺序为:从左到右,从上到下。
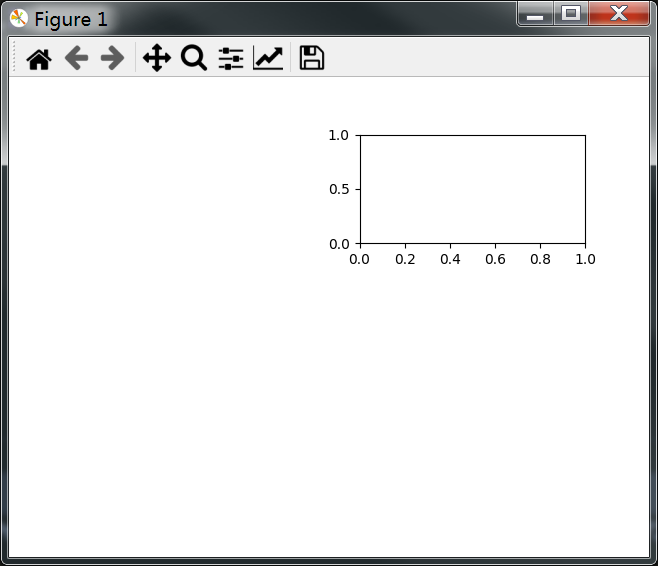
简单例子如下
from pylab import *

figure(1)
subplot(3,2,2)
show()
绘制效果图如下
3 MatPlot2figs 绘制效果
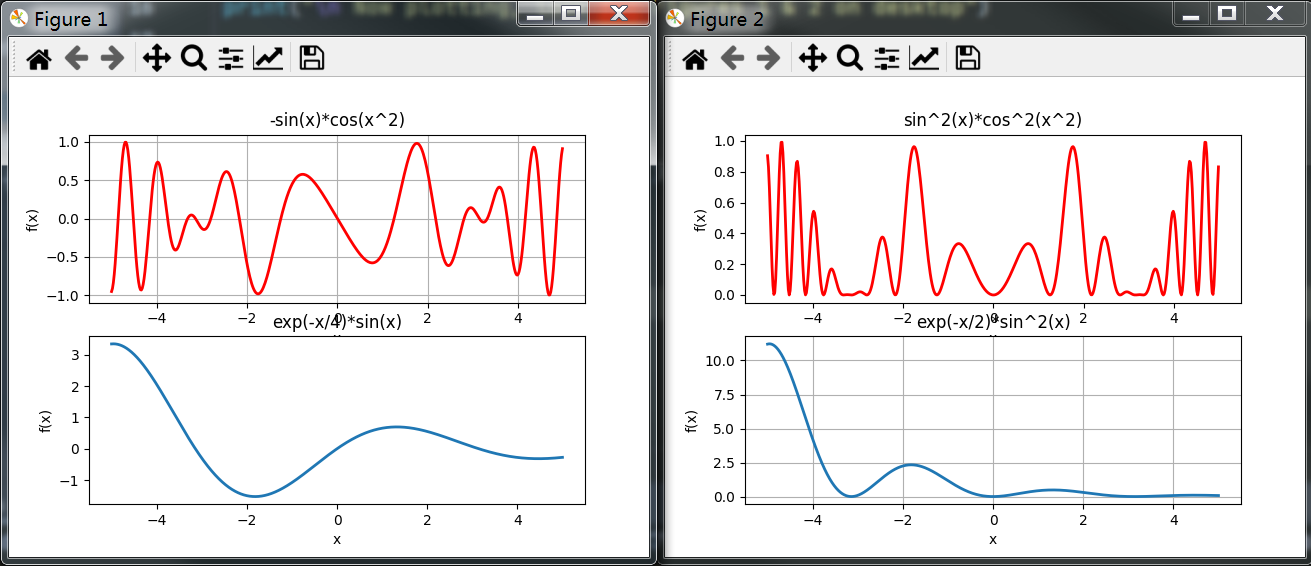
此时再看MatPlot2figs.py, 就很好看明白了。
from pylab import *      # MatPlot2figs.py

Xmin = -5.0;      Xmax =  5.0;        Npoints= 500
DelX= (Xmax-Xmin)/Npoints                             # Delta x
x1 = arange(Xmin, Xmax, DelX)                        # x1 range
x2 = arange(Xmin, Xmax, DelX/20)            # Different x2 range
y1 =  -sin(x1)*cos(x1*x1)                           # Function 1
y2 =   exp(-x2/4.)*sin(x2)                          # Function 2
print("\n Now plotting, look for Figures 1 & 2 on desktop")

figure(1)
subplot(2,1,1)                     # 1st subplot in first figure
plot(x1, y1, 'r', lw=2)
xlabel('x');      ylabel( 'f(x)' ); title( '-sin(x)*cos(x^2)' )
grid(True)                                         # Form grid
subplot(2,1,2)                     # 2nd subplot in first figure
plot(x2, y2, '-', lw=2)
xlabel('x')                                        # Axes labels
ylabel( 'f(x)' )
title( 'exp(-x/4)*sin(x)' )

#                                  Figure 2
figure(2)
subplot(2,1,1)                     # 1st subplot in 2nd figure
plot(x1, y1*y1, 'r', lw=2)
xlabel('x'); ylabel('f(x)'); title('sin^2(x)*cos^2(x^2)') # grid
subplot(2,1,2)                       # 2nd subplot in 2nd figure
plot(x2, y2*y2, '-', lw=2)
xlabel('x');   ylabel( 'f(x)' );  title( 'exp(-x/2)*sin^2(x)' )
grid(True)
show()                                           # Show graphs
其绘制效果如图
9 - 1.6 Simple3Dplot.py
1 meshgrid
meshgrid是numpy中的方法,用于从坐标向量(一维)返回坐标矩阵(多维)。
简单写法为np.meshgrid(*xi)
*xi:*代表可以接受不定数量个参数,每个参数为表示网格坐标的一维数组。
x1, x2,…, xn array_like.
1-D arrays representing the coordinates of a grid.
代码示例
import numpy as np

delta = 0.5
x = np.arange( -2., 2., delta )
y = np.arange( -1., 1., delta )
X, Y = np.meshgrid(x, y)
Z = np.sin(X) * np.cos(Y)
print(X)
# [[-2.  -1.5 -1.  -0.5  0.   0.5  1.   1.5]
#  [-2.  -1.5 -1.  -0.5  0.   0.5  1.   1.5]
#  [-2.  -1.5 -1.  -0.5  0.   0.5  1.   1.5]
#  [-2.  -1.5 -1.  -0.5  0.   0.5  1.   1.5]]
print(Y)
# [[-1.  -1.  -1.  -1.  -1.  -1.  -1.  -1. ]
#  [-0.5 -0.5 -0.5 -0.5 -0.5 -0.5 -0.5 -0.5]
#  [ 0.   0.   0.   0.   0.   0.   0.   0. ]
#  [ 0.5  0.5  0.5  0.5  0.5  0.5  0.5  0.5]]
print(Z)
# [[-0.4912955  -0.53894884 -0.45464871 -0.25903472  0.          0.25903472  0.45464871  0.53894884]
#  [-0.79798357 -0.87538421 -0.73846026 -0.42073549  0.          0.42073549  0.73846026  0.87538421]
#  [-0.90929743 -0.99749499 -0.84147098 -0.47942554  0.          0.47942554  0.84147098  0.99749499]
#  [-0.79798357 -0.87538421 -0.73846026 -0.42073549  0.          0.42073549  0.73846026  0.87538421]]
直播间某位会matlab的观众弹幕补充(是否适用于matplotlib待确定):
要绘制3d网格的话要3点坐标,必须使用2d网格。
如果只是绘制3D线条就不用了(不需要使用meshgrid)
2 Axes3D
mpl_toolkits.mplot3d.axes3d.Axes3D(fig, **kwargs)
绘制三维坐标轴,返回一个坐标轴对象。
Simple3Dplot.py中,该对象用到的方法:
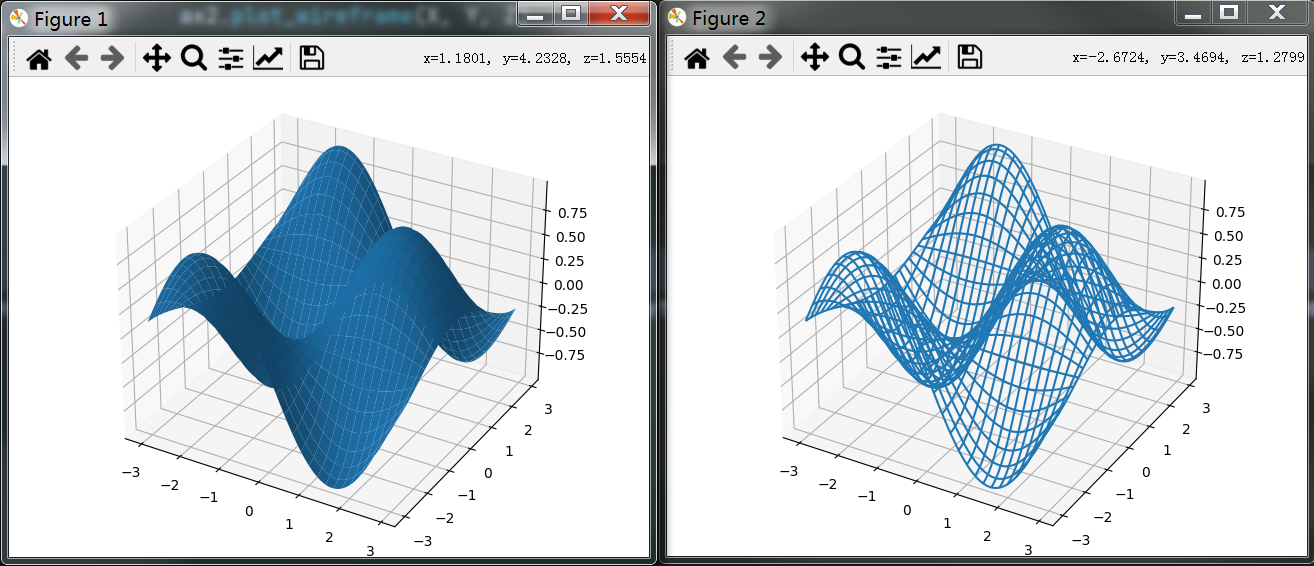
plot_surface(X, Y, Z)绘制曲面plot_wireframe(X, Y, Z, color = 'r')绘制3D线框
上面两个方法X, Y, Z都必须是2D array。
两个方法效果分别如下图
(左边是plot_surface绘制曲面,右边是plot_wireframe绘制线框)
set_xlabel(xlabel)set_ylabel(ylabel)set_zlabel(zlabel)
分别设置x,y,z轴的标签
3 Simple3Dplot 绘制效果
import matplotlib.pylab  as p  # Simple3Dplot.py
from mpl_toolkits.mplot3d import Axes3D

print("Please be patient while I do importing & plotting")
delta = 0.1
x = p.arange( -3., 3., delta )
y = p.arange( -3., 3., delta )
X, Y = p.meshgrid(x, y)
Z = p.sin(X) * p.cos(Y)                       # Surface height


fig = p.figure()                               # Create figure
ax = Axes3D(fig)                                  # Plots axes
ax.plot_surface(X, Y, Z)                            # Surface
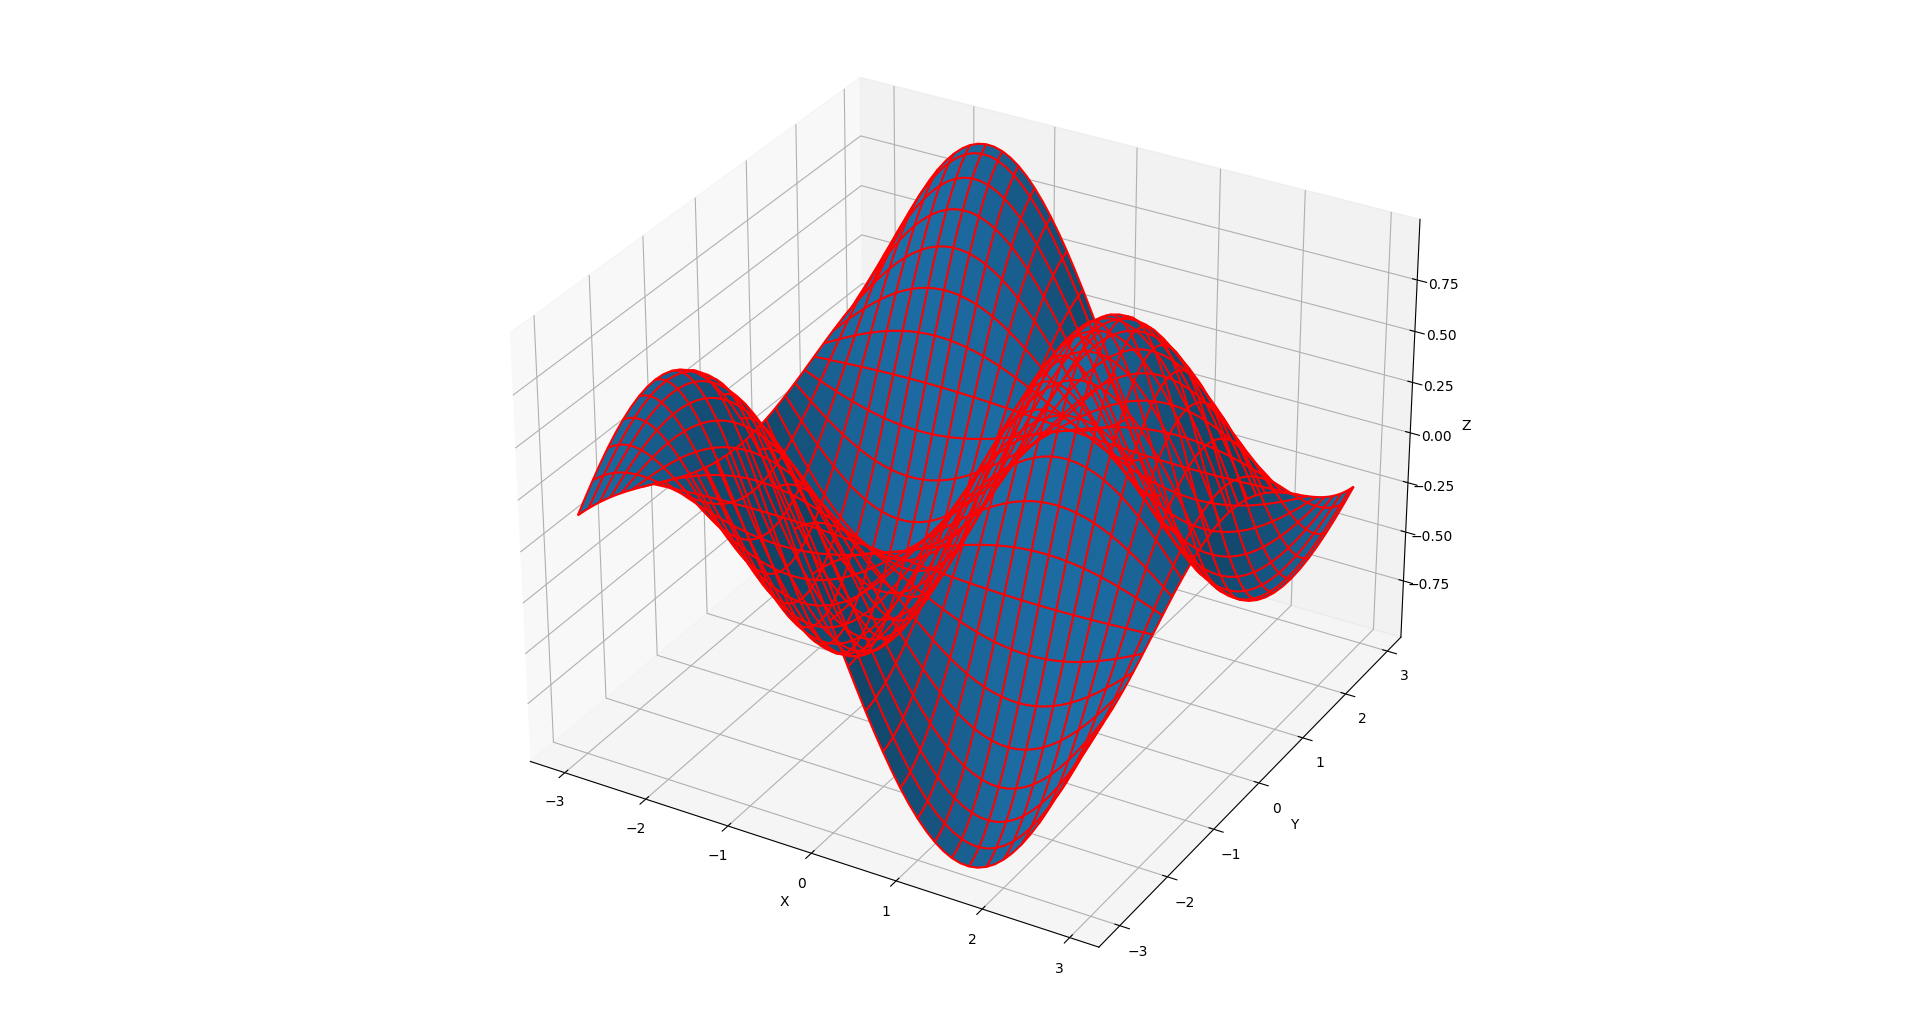
ax.plot_wireframe(X, Y, Z, color = 'r')        # Add wireframe
ax.set_xlabel('X')
ax.set_ylabel('Y')
ax.set_zlabel('Z')
p.show()                                        # Output figure
绘制效果如图
 601


 扫一扫


 被折叠的 条评论
为什么被折叠?
 到【灌水乐园】发言


