


Amazon Inferentia2是亚马逊云科技自主研发的云上机器学习推理芯片,专为深度学习推理工作负载提供高性能、高效率的计算能力,助力客户在云上高效部署和运行机器学习模型。
在大模型部署过程中,客户常常面临如何评估性能和优化推理效率的挑战。本文将以Amazon Inferentia2为测试环境,重点探讨如何评估模型推理性能。同时将基于vLLM部署模型,介绍如何使用Prometheus和Grafana获取推理性能参数,并解析关键指标的含义。
*由于本篇文章的重点在于性能参数的解读,因此不涉及Inferentia2的规格介绍及运行配置优化。
部署模型
部署环境所需的Amazon EC2
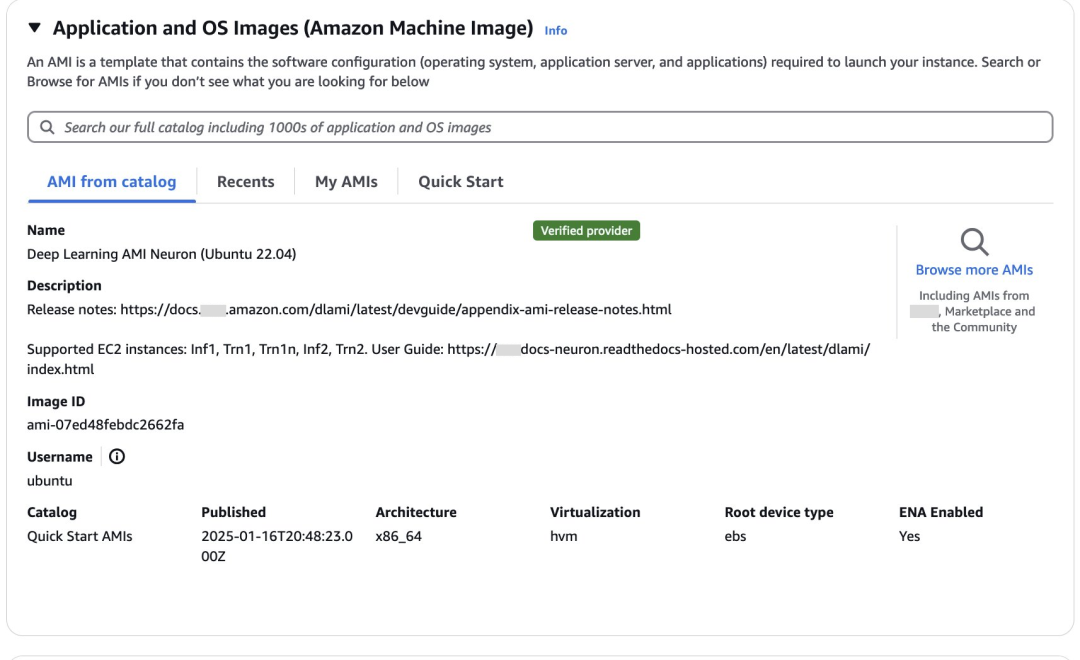
部署镜像选择Deep Learning AMI Neuron(Ubuntu 22.04)。Deep Learning AMI是专门为在亚马逊云科技云上进行深度学习和机器学习优化而提供的镜像,预装了主流深度学习框架,包括TensorFlow、PyTorch和MXNet等,内置Amazon Web Services Neuron SDK开发工具包,支持在Amazon Inferentia和Trainium芯片上运行工作负载。
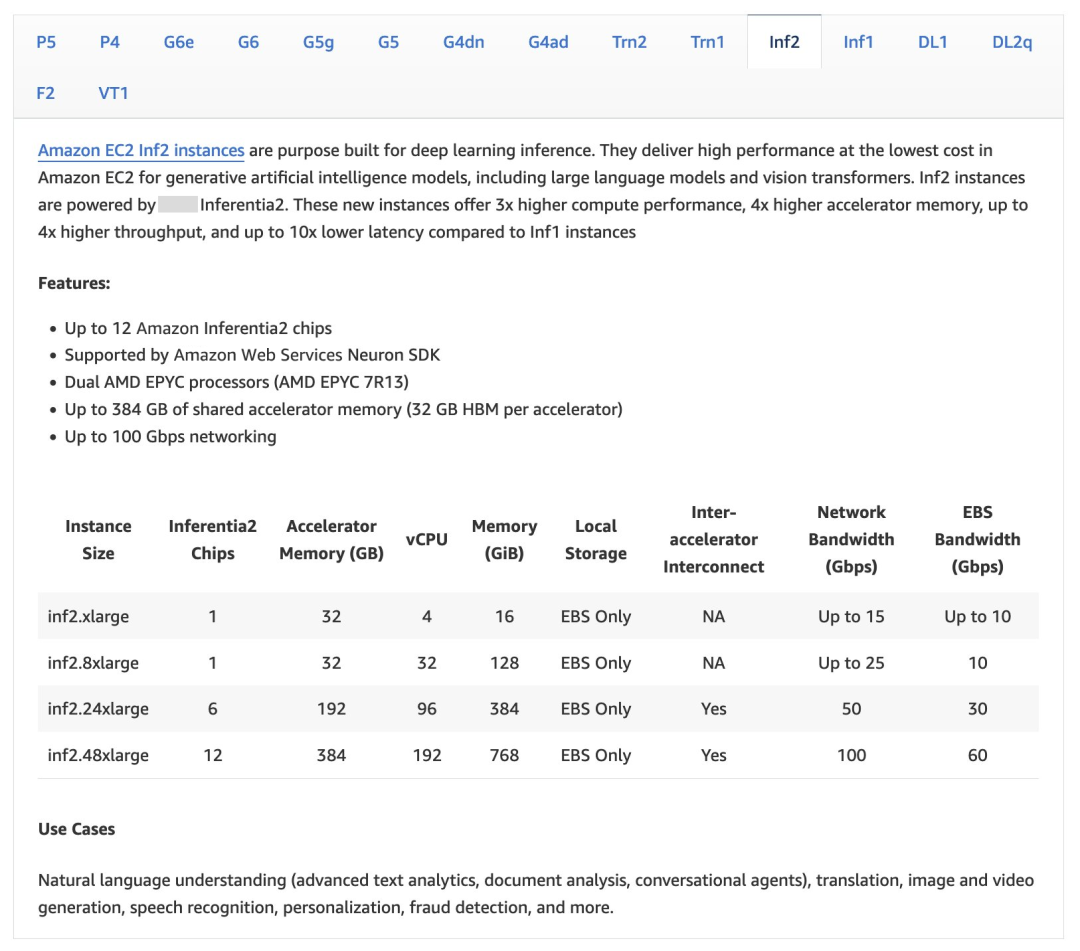
Amazon Inferentia2提供包含1、6和12卡的不同规格,您可参考以下截图。
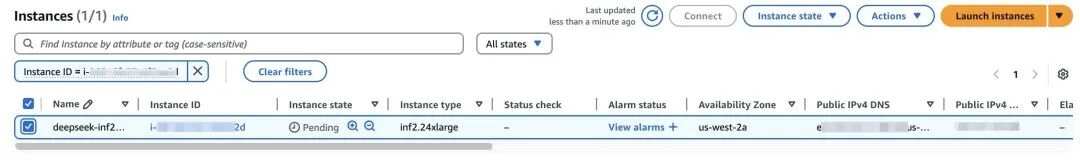
等待资源部署完成。
安装vllm支持分布式推理
vllm
vLLM是伯克利大学LMSYS组织开源的大语言模型(LLM)高速推理框架,旨在提升实时场景下语言模型服务的吞吐与内存使用效率。PagedAttention和Continuous Batching等核心技术在保持低延迟的同时,显著提升LLM服务的吞吐量,并且大幅降低内存开销,解决LLM推理受限于显存由于带宽或者成本的带来的容量限制。
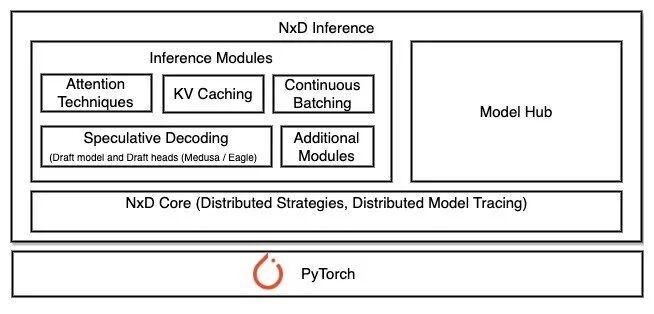
NxD inference
NxD(NeuronX Distributed)Inference是一个基于PyTorch的开源推理库,专门用于在Amazon Inferentia和Trainium实例上简化深度学习模型部署。该库在Neuron SDK 2.21版本中推出。NxD Inference简化了深度学习模型的部署过程,实现了高性能推理。
NxD Inference具有以下特点。
1.支持Llama、DBRX和Mixtral等模型的快速部署。
2.LLM推理功能支持连续批处理(continuous batching),支持推测解码(speculative decoding)等。
3.架构优势:
便于开发者自定义和扩展功能。
支持张量并行和序列并行,未来将支持流水线并行和多节点推理。
4.三种集成方式:
通过vLLM部署。
直接使用NxDI,适用于不使用vLLM的场景,支持静态批处理。
底层集成,可以直接使用推理模块和NxD核心原语,适合需要自定义的场景。
更多信息,请参阅下方链接。
NxD Inference概览:
https://awsdocs-neuron.readthedocs-hosted.com/en/latest/libraries/nxd-inference/nxdi-overview.html#nxdi-overview
NxD Inference和vllm的集成
NxD Inference通过扩展vLLM的模型执行组件来实现集成,复用vLLM的LLMEngine架构,保持了vLLM原有的输入处理、调度和输出处理流程,主要修改了Model Runner和Model部分使其支持Neuron硬件。
使用时非常简单,只需要设置device=“neuron”参数,而其他的vllm的API使用方式保持不变,就可以像通常的使用方式一样进行模型加载和推理。
目前支持方式包含连续批处理(continous batching)和流式生成(streaming generation),PagedAttention和Chuncked Prefill还在开发中。
目前支持的模型:
DBRX
LLama 2,3,3.1,3.2(1B和3B),3.3
Mistral-V2
Mixtral
安装vllm
source /opt/aws_neuronx_venv_pytorch_2_5_nxd_inference/bin/activatesudo apt-get install git-lfsgit lfs install
左右滑动查看完整示意
更多信息,请参阅下方链接。
Git仓库:
https://docs.github.com/repositories/working-with-files/managing-large-files/about-git-large-file-storage
LLM文件通常非常大(几GB到几十GB),超出了Git的正常文件处理能力。Git-lfs将大型模型文件替换为文本指针存储在Git仓库中,而实际的模型文件内容存储在远程服务器上,只在需要时才下载实际的模型文件。使用git-lfs的优势是支持断点续传,更高效地管理大型二进制文件,减少Git仓库的体积。
安装transformers-neruonx和相关依赖。
# Install Jupyter notebook kernelpip install ipykernelpython3.10 -m ipykernel install --user --name aws_neuron_venv_pytorch --display-name "Python (torch-neuronx)"pip install jupyter notebookpip install environment_kernels# Set pip repository pointing to the Neuron repositorypython -m pip config set global.extra-index-url https://pip.repos.neuron.amazonaws.com# Install wget, awsclipython -m pip install wgetpython -m pip install awscli# Update Neuron Compiler and Frameworkpython -m pip install --upgrade neuronx-cc==2.* --pre torch-neuronx==2.1.* torchvision transformers-neuronx
左右滑动查看完整示意
install vllm from source。
git clone https://github.com/vllm-project/vllm.gitcd vllmpip install -U -r requirements-neuron.txtpip install .
左右滑动查看完整示意
从Hugging Face下载模型。
huggingface-cli login<Use your huggingface token>
下载。
huggingface-cli download deepseek-ai/DeepSeek-R1-Distill-Llama-8B
左右滑动查看完整示意
启动推理。
export MODEL_PATH=/home/ubuntu/.cache/huggingface/hub/models--deepseek-ai--DeepSeek-R1-Distill-Llama-8B/snapshots/ebf7e8d03db3d86a442d22d30d499abb7ec27bea/cd vllm/python3 -m vllm.entrypoints.openai.api_server \--model $MODEL_PATH \--served-model-name DeepSeek-R1-Distill-Llama-8B \--tensor-parallel-size 2 \--max-model-len 2048 \--max-num-seqs 4 \--block-size 8 \--use-v2-block-manager \--device neuron \--port 8000
左右滑动查看完整示意
基础参数:
--model $MODEL_PATH:指定模型文件的路径位置。
--served-model-name:设置服务的模型名称,此处是”DeepSeek-R1-Distill-Llama-8B”。
--port 8000:设置服务监听的端口号。
并行和性能参数:
--tensor-parallel-size 2:设置张量并行的大小为2,用于在多个设备间分配模型。
--max-model-len 2048:设置模型最大处理的序列长度为2048个token。
--max-num-seqs 4:设置最大并发处理的序列数量为4。
内存管理参数:
--block-size 8:设置KV缓存块的大小为8。
--use-v2-block-manager:启用V2版本的块管理器,这是更高效的内存管理方案。
硬件参数:
--device neuron:指定使用Amazon Neuron设备进行推理,这是针对Amazon Inferentia芯片优化的设置。
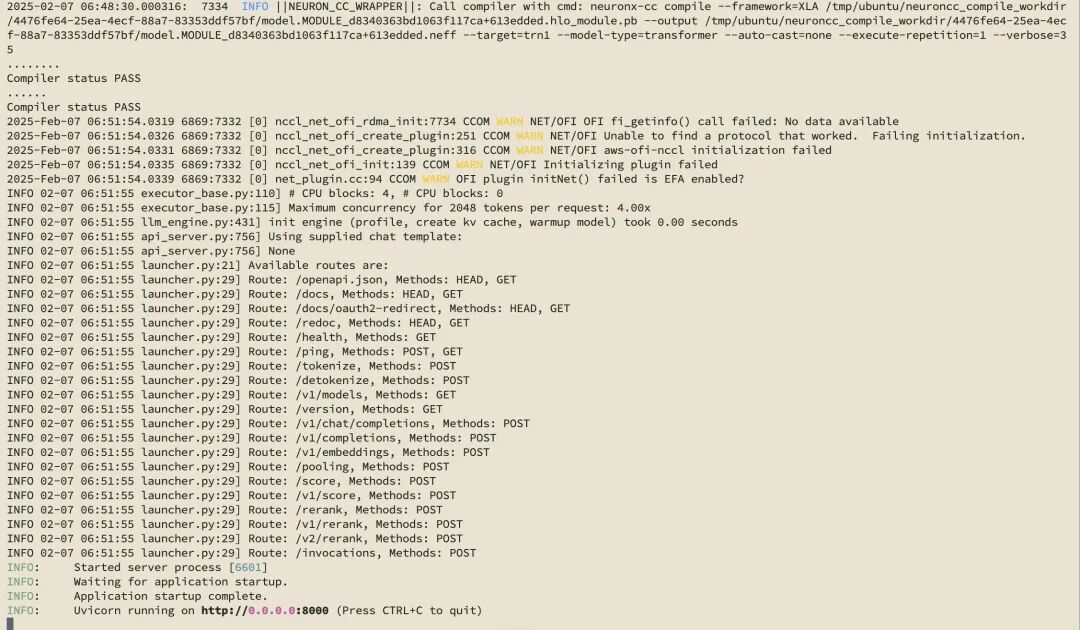
运行成功。
测试。
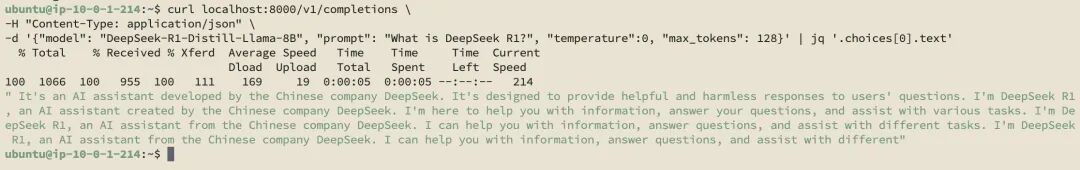
curl localhost:8000/v1/completions \ -H "Content-Type: application/json" \ -d '{"model": "DeepSeek-R1-Distill-Llama-8B", "prompt": "What is DeepSeek R1?", "temperature":0, "max_tokens": 128}' | jq '.choices[0].text'左右滑动查看完整示意
如何监控模型的性能
LLM部署时需要关注的指标
LLM部署时主要关注性能指标和质量指标。
性能指标
1.延迟指标:
首Token延迟(TTFT):从请求开始到返回第一个token的时间。
每输出Token延迟(TPOT):每个输出token的延迟(不含首个token)。
总体延迟(Latency):从用户发出请求到收到完整请求的时间。
2.吞吐量指标:
每秒请求数(QPS/RPS):系统每秒处理的请求数量。
每秒Token数(TPS):系统每秒处理的token数量。
质量指标
1.准确性评估:预测正确的样本占总样本比例。
2.生成质量:预测为正样本中真正为正样本的比例。
3.可靠性指标:模型预测样本的好坏程度。
本文主要讨论和LLM相关的性能指标,理由如下。
1.影响用户体验:延迟会影响用户体验,例如首字节延迟决定用户等待首次响应的时间;token间延迟(ITL)影响用户获得连续响应的流畅度。
2.控制运营成本:更高的吞吐量意味着可以用更少的硬件资源时间完成更多的请求,从而降低服务器的使用成本。
根据应用的不同场景,对于性能指标也有不同的优化重点。例如,在线流式应用优先会关注每个输出词元的延迟(TPOT)和端到端延迟;离线批量处理的应用会主要关注整体吞吐量。
因此根据应用场景持续监控和优化性能指标,可以在保证用户体验的同时,实现资源的最优配置和成本的有效控制。
vllm的性能监控指标
vllm提供了这些指标:
curl http://0.0.0.0:8000/metrics。
输出结果如下。
curl http://0.0.0.0:8000/metrics # HELP vllm:iteration_tokens_total Histogram of number of tokens per engine_step. # TYPE vllm:iteration_tokens_total histogram vllm:iteration_tokens_total_sum{model_name="DeepSeek-R1-Distill-Llama-8B"} 272.0 vllm:iteration_tokens_total_bucket{le="1.0",model_name="DeepSeek-R1-Distill-Llama-8B"} 271.0 vllm:iteration_tokens_total_bucket{le="2.0",model_name="DeepSeek-R1-Distill-Llama-8B"} 271.0 # HELP vllm:time_to_first_token_seconds Histogram of time to first token in seconds. # TYPE vllm:time_to_first_token_seconds histogram vllm:time_to_first_token_seconds_sum{model_name="DeepSeek-R1-Distill-Llama-8B"} 0.8229701519012451 vllm:time_to_first_token_seconds_bucket{le="0.001",model_name="DeepSeek-R1-Distill-Llama-8B"} 0.0 v .... vllm:time_to_first_token_seconds_count{model_name="DeepSeek-R1-Distill-Llama-8B"} 2.0 # HELP vllm:time_per_output_token_seconds Histogram of time per output token in seconds. # TYPE vllm:time_per_output_token_seconds histogram vllm:time_per_output_token_seconds_sum{model_name="DeepSeek-R1-Distill-Llama-8B"} 10.362053394317627 .... vllm:time_per_output_token_seconds_count{model_name="DeepSeek-R1-Distill-Llama-8B"} 254.0 # HELP vllm:e2e_request_latency_seconds Histogram of end to end request latency in seconds. # TYPE vllm:e2e_request_latency_seconds histogram vllm:e2e_request_latency_seconds_sum{model_name="DeepSeek-R1-Distill-Llama-8B"} 11.185362100601196 .... vllm:e2e_request_latency_seconds_bucket{le="+Inf",model_name="DeepSeek-R1-Distill-Llama-8B"} 2.0 vllm:e2e_request_latency_seconds_count{model_name="DeepSeek-R1-Distill-Llama-8B"} 2.0 # HELP vllm:request_queue_time_seconds Histogram of time spent in WAITING phase for request. # TYPE vllm:request_queue_time_seconds histogram vllm:request_queue_time_seconds_sum{model_name="DeepSeek-R1-Distill-Llama-8B"} 0.0014662742614746094 .... vllm:request_queue_time_seconds_count{model_name="DeepSeek-R1-Distill-Llama-8B"} 2.0 # HELP vllm:request_inference_time_seconds Histogram of time spent in RUNNING phase for request. # TYPE vllm:request_inference_time_seconds histogram vllm:request_inference_time_seconds_sum{model_name="DeepSeek-R1-Distill-Llama-8B"} 11.183895826339722 .... vllm:request_inference_time_seconds_count{model_name="DeepSeek-R1-Distill-Llama-8B"} 2.0 # HELP vllm:request_prefill_time_seconds Histogram of time spent in PREFILL phase for request. # TYPE vllm:request_prefill_time_seconds histogram vllm:request_prefill_time_seconds_sum{model_name="DeepSeek-R1-Distill-Llama-8B"} 0.8215038776397705 .... vllm:request_prefill_time_seconds_count{model_name="DeepSeek-R1-Distill-Llama-8B"} 2.0 # HELP vllm:request_decode_time_seconds Histogram of time spent in DECODE phase for request. # TYPE vllm:request_decode_time_seconds histogram vllm:request_decode_time_seconds_sum{model_name="DeepSeek-R1-Distill-Llama-8B"} 10.362391948699951 .... vllm:request_decode_time_seconds_count{model_name="DeepSeek-R1-Distill-Llama-8B"} 2.0 # HELP vllm:time_in_queue_requests Histogram of time the request spent in the queue in seconds. # TYPE vllm:time_in_queue_requests histogram vllm:time_in_queue_requests_sum{model_name="DeepSeek-R1-Distill-Llama-8B"} 0.0014662742614746094 .... vllm:time_in_queue_requests_bucket{le="+Inf",model_name="DeepSeek-R1-Distill-Llama-8B"} 2.0 vllm:time_in_queue_requests_count{model_name="DeepSeek-R1-Distill-Llama-8B"} 2.0 # HELP vllm:request_prompt_tokens Number of prefill tokens processed. # TYPE vllm:request_prompt_tokens histogram vllm:request_prompt_tokens_sum{model_name="DeepSeek-R1-Distill-Llama-8B"} 16.0 .... vllm:request_prompt_tokens_bucket{le="+Inf",model_name="DeepSeek-R1-Distill-Llama-8B"} 2.0 vllm:request_prompt_tokens_count{model_name="DeepSeek-R1-Distill-Llama-8B"} 2.0 # HELP vllm:request_generation_tokens Number of generation tokens processed. # TYPE vllm:request_generation_tokens histogram vllm:request_generation_tokens_sum{model_name="DeepSeek-R1-Distill-Llama-8B"} 256.0 .... vllm:request_generation_tokens_count{model_name="DeepSeek-R1-Distill-Llama-8B"} 2.0 # HELP vllm:request_params_n Histogram of the n request parameter. # TYPE vllm:request_params_n histogram vllm:request_params_n_sum{model_name="DeepSeek-R1-Distill-Llama-8B"} 2.0 vllm:request_params_n_bucket{le="1.0",model_name="DeepSeek-R1-Distill-Llama-8B"} 2.0 .... vllm:request_params_n_count{model_name="DeepSeek-R1-Distill-Llama-8B"} 2.0 # HELP vllm:request_max_num_generation_tokens Histogram of maximum number of requested generation tokens. # TYPE vllm:request_max_num_generation_tokens histogram vllm:request_max_num_generation_tokens_sum{model_name="DeepSeek-R1-Distill-Llama-8B"} 256.0 .... vllm:request_max_num_generation_tokens_count{model_name="DeepSeek-R1-Distill-Llama-8B"} 2.0 # HELP vllm:request_params_max_tokens Histogram of the max_tokens request parameter. # TYPE vllm:request_params_max_tokens histogram vllm:request_params_max_tokens_sum{model_name="DeepSeek-R1-Distill-Llama-8B"} 256.0 .... vllm:request_params_max_tokens_bucket{le="+Inf",model_name="DeepSeek-R1-Distill-Llama-8B"} 2.0 vllm:request_params_max_tokens_count{model_name="DeepSeek-R1-Distill-Llama-8B"} 2.0 # HELP vllm:lora_requests_info Running stats on lora requests. # TYPE vllm:lora_requests_info gauge vllm:lora_requests_info{max_lora="0",running_lora_adapters="",waiting_lora_adapters=""} 1.7387586964559853e+09 # HELP vllm:num_preemptions_total Cumulative number of preemption from the engine. # TYPE vllm:num_preemptions_total counter vllm:num_preemptions_total{model_name="DeepSeek-R1-Distill-Llama-8B"} 0.0 # HELP vllm:prompt_tokens_total Number of prefill tokens processed. # TYPE vllm:prompt_tokens_total counter vllm:prompt_tokens_total{model_name="DeepSeek-R1-Distill-Llama-8B"} 16.0 # HELP vllm:generation_tokens_total Number of generation tokens processed. # TYPE vllm:generation_tokens_total counter vllm:generation_tokens_total{model_name="DeepSeek-R1-Distill-Llama-8B"} 256.0 # HELP vllm:request_success_total Count of successfully processed requests. # TYPE vllm:request_success_total counter vllm:request_success_total{finished_reason="length",model_name="DeepSeek-R1-Distill-Llama-8B"} 2.0 # HELP vllm:num_requests_running Number of requests currently running on GPU. # TYPE vllm:num_requests_running gauge vllm:num_requests_running{model_name="DeepSeek-R1-Distill-Llama-8B"} 0.0 # HELP vllm:num_requests_swapped Number of requests swapped to CPU. # TYPE vllm:num_requests_swapped gauge vllm:num_requests_swapped{model_name="DeepSeek-R1-Distill-Llama-8B"} 0.0 # HELP vllm:num_requests_waiting Number of requests waiting to be processed. # TYPE vllm:num_requests_waiting gauge vllm:num_requests_waiting{model_name="DeepSeek-R1-Distill-Llama-8B"} 0.0 # HELP vllm:gpu_cache_usage_perc GPU KV-cache usage. 1 means 100 percent usage. # TYPE vllm:gpu_cache_usage_perc gauge vllm:gpu_cache_usage_perc{model_name="DeepSeek-R1-Distill-Llama-8B"} 0.0 # HELP vllm:cpu_cache_usage_perc CPU KV-cache usage. 1 means 100 percent usage. # TYPE vllm:cpu_cache_usage_perc gauge vllm:cpu_cache_usage_perc{model_name="DeepSeek-R1-Distill-Llama-8B"} 0.0 # HELP vllm:cpu_prefix_cache_hit_rate CPU prefix cache block hit rate. # TYPE vllm:cpu_prefix_cache_hit_rate gauge vllm:cpu_prefix_cache_hit_rate{model_name="DeepSeek-R1-Distill-Llama-8B"} -1.0 # HELP vllm:gpu_prefix_cache_hit_rate GPU prefix cache block hit rate. # TYPE vllm:gpu_prefix_cache_hit_rate gauge vllm:gpu_prefix_cache_hit_rate{model_name="DeepSeek-R1-Distill-Llama-8B"} -1.0 # HELP vllm:cache_config_info Information of the LLMEngine CacheConfig # TYPE vllm:cache_config_info gauge vllm:cache_config_info{block_size="2048",cache_dtype="auto",calculate_kv_scales="False",cpu_offload_gb="0",enable_prefix_caching="False",gpu_memory_utilization="0.9",is_attention_free="False",num_cpu_blocks="0",num_gpu_blocks="4",num_gpu_blocks_override="None",sliding_window="None",swap_space_bytes="4294967296"} 1.0左右滑动查看完整示意
但是该输出看起来并不直观,还是需要图形化的展示,便于在部署LLM后能更加清楚地了解模型的性能情况。Prometheus与Grafana可以帮助实现该要求。
通过Prometheus+Grafana优化监控面板
您可参阅以下资源。
Prometheus与Grafana文档:
https://docs.vllm.ai/en/latest/getting_started/examples/prometheus_grafana.html
Git仓库:
https://github.com/vllm-project/vllm/tree/main/examples/online_serving/prometheus_grafana
可使用vllm提供的样例,其中Prometheus的采样周期在prometheus.yaml中定义为5秒。
~/vllm/examples/online_serving/prometheus_grafana$ tree ./ ./ ├── README.md ├── docker-compose.yaml ├── grafana.json └── prometheus.yaml
0 directories, 4 files
左右滑动查看完整示意
启动prometheus和grafana服务。
docker compose up
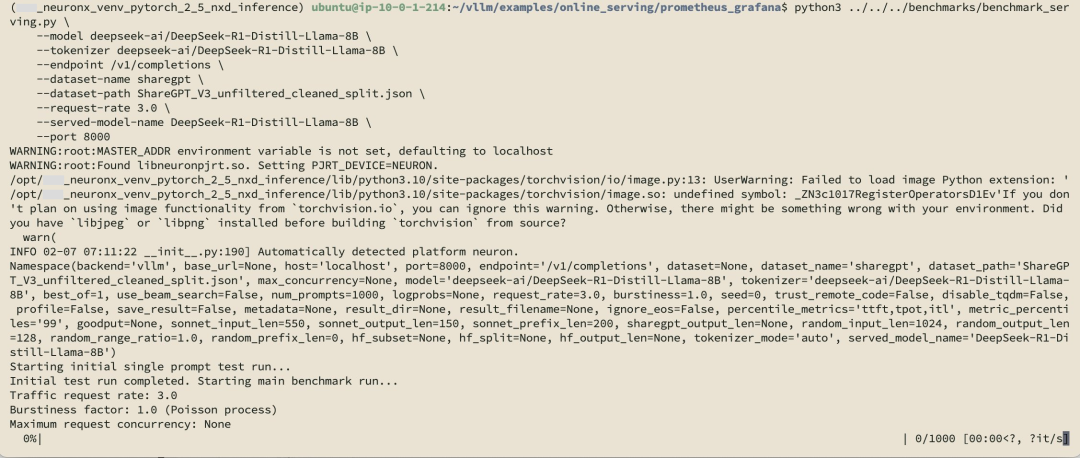
为了能拿到更丰富测试数据以便于展示的性能指标,运行benchmark测试。
python3 ../../../benchmarks/benchmark_serving.py \ --model deepseek-ai/DeepSeek-R1-Distill-Llama-8B \--tokenizer deepseek-ai/DeepSeek-R1-Distill-Llama-8B \--endpoint /v1/completions \--dataset-name sharegpt \--dataset-path ShareGPT_V3_unfiltered_cleaned_split.json \--request-rate 3.0 \--served-model-name DeepSeek-R1-Distill-Llama-8B \--port 8000
左右滑动查看完整示意
ShareGPT_V3_unfiltered_cleaned_split是一个广泛用于LLM性能测试的数据集,包含了客户和LLM之间的真实对话数据,用于评估在不同输入长度下的性能表现,测量模型的吞吐速度和生成速度。该数据集已成为多个主流LLM推理框架的标准测试数据集,您可从Hugging Face或其镜像站点下载。
wget https://huggingface.co/datasets/anon8231489123/ShareGPT_Vicuna_unfiltered/resolve/main/ShareGPT_V3_unfiltered_cleaned_split.json
左右滑动查看完整示意
安装在DLA中缺少的一些库。
pip install datasets
运行结果截图如下。
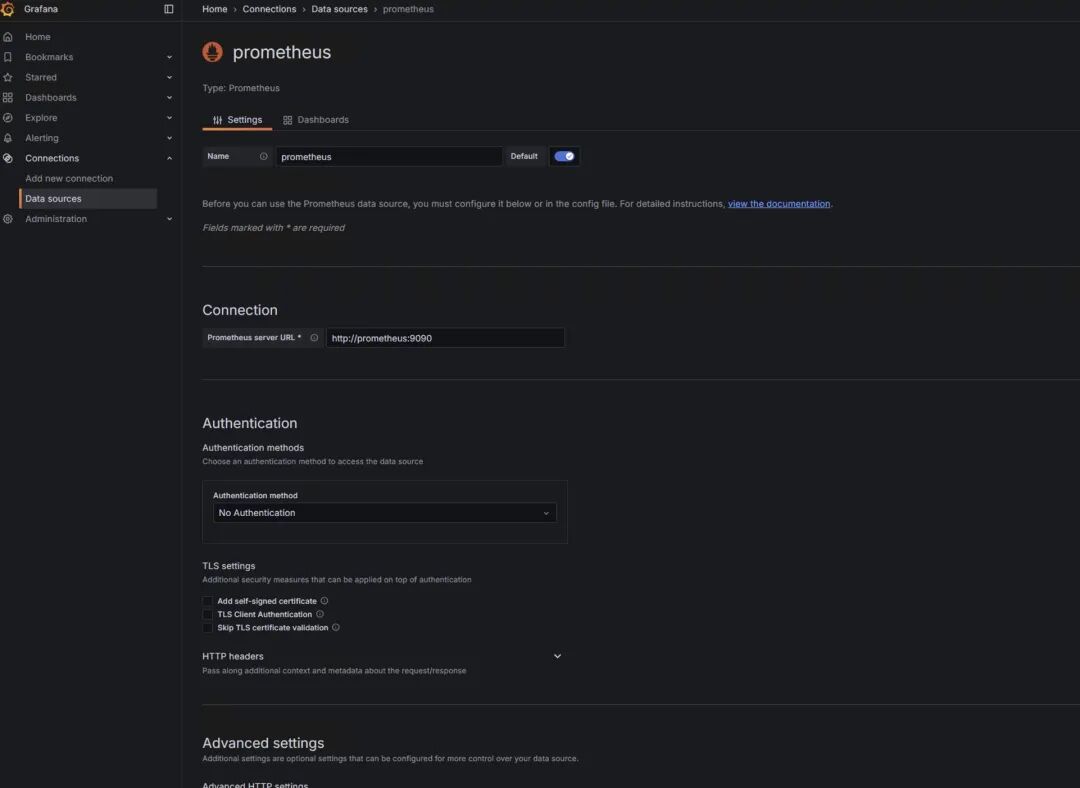
开始配置Grafana与Prometheus:
使用初始密码admin/admin登陆http://[ip]:3000。
添加connections→data sources。
save&test:
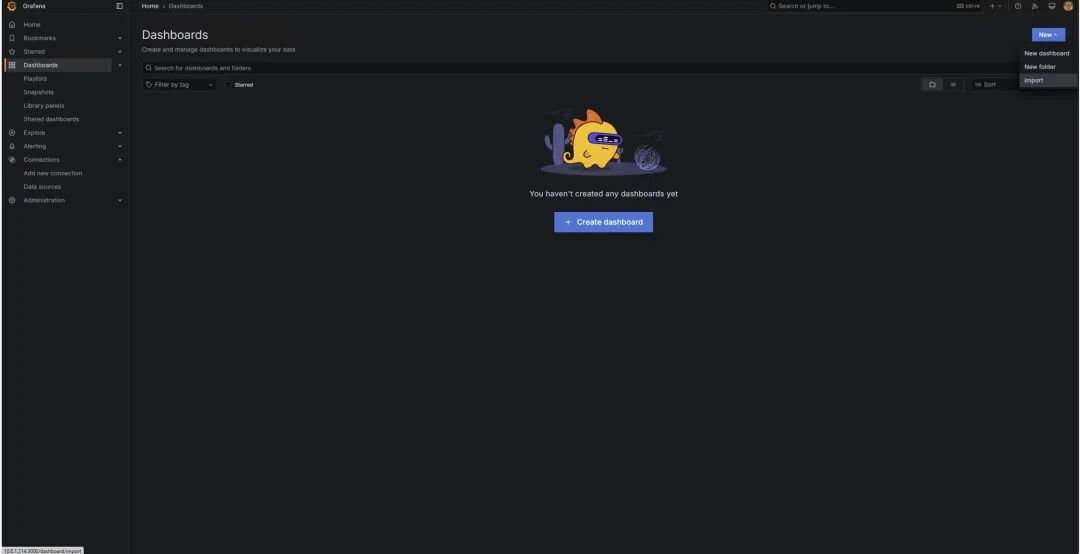
创建Grafana dashboard,选择右上角New→import。
您可参阅下方文档链接,使用vllm提供的版本。
注意将其中的模型替换为通过vllm启动的模型。
Prometheus与Grafana文档:
https://docs.vllm.ai/en/latest/getting_started/examples/prometheus_grafana.html
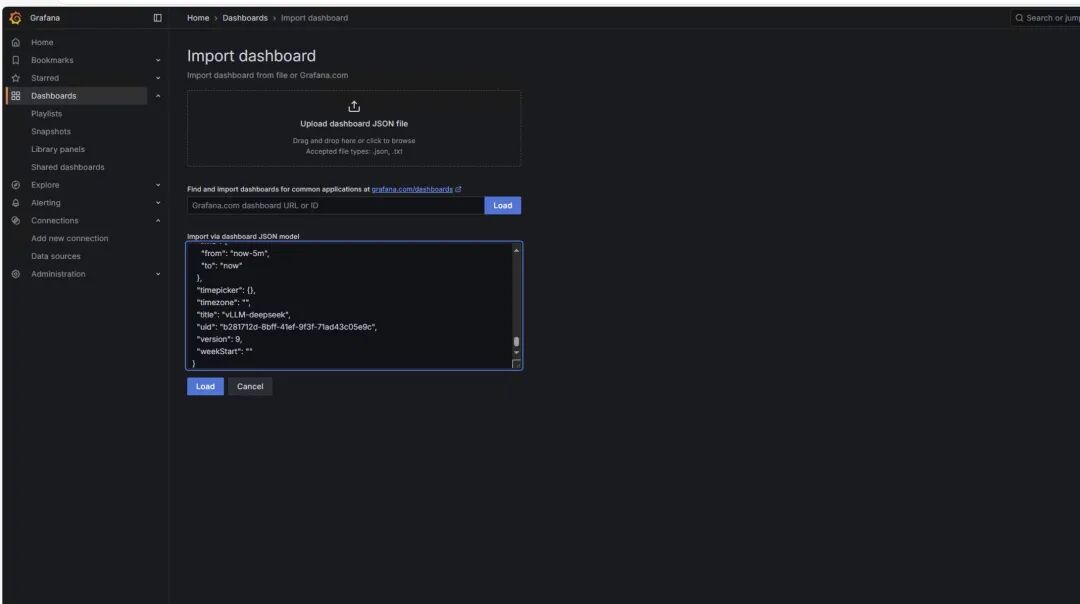
选择“load”,得到以下监控图标。
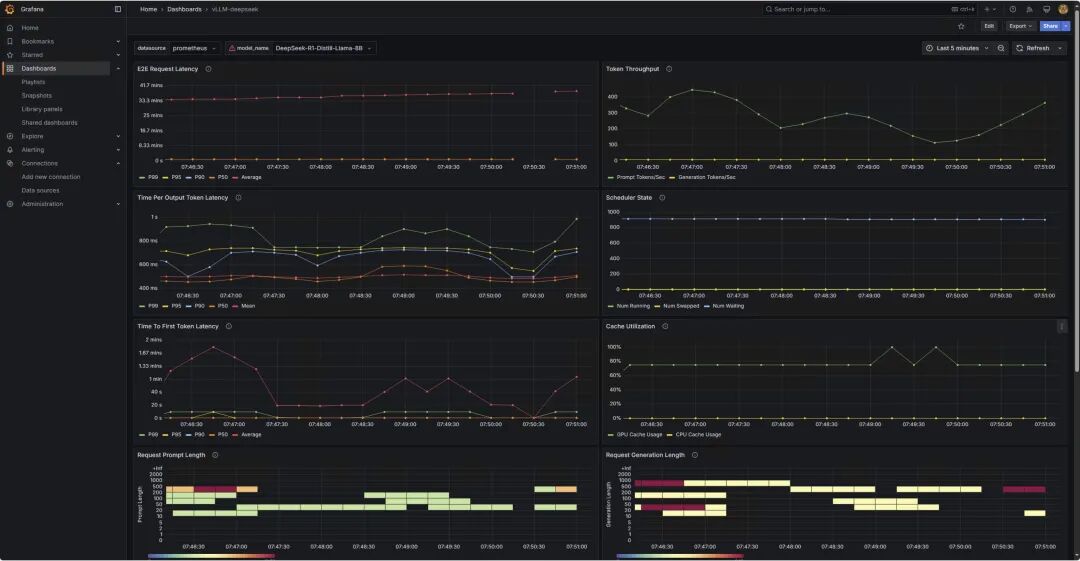
了解监控图表
*监控图表仅作为展示,并不和上述运行配置对应。
1
请求情况
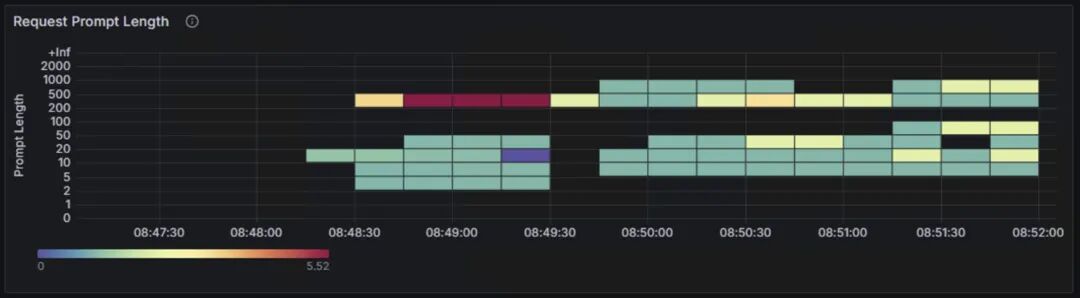
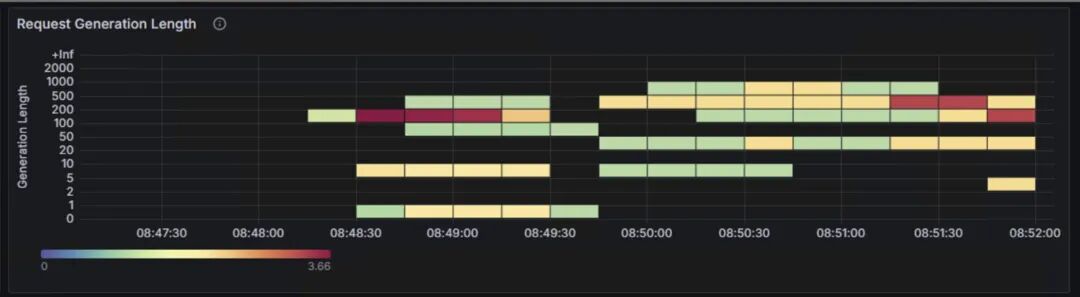
上面两张图表为benchmark测试输入的prompt token数量,和LLM生成的token数量的分布情况。两张表的纵轴表示输入和生成的token数的长度区间,从0~2000 token;横轴表示测试的时间范围。颜色由浅绿、到黄色、再到深红的渐变表示请求次数。
2
负载情况
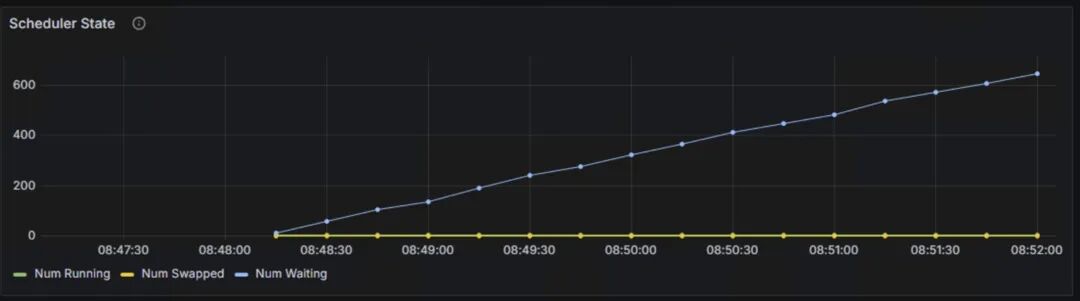
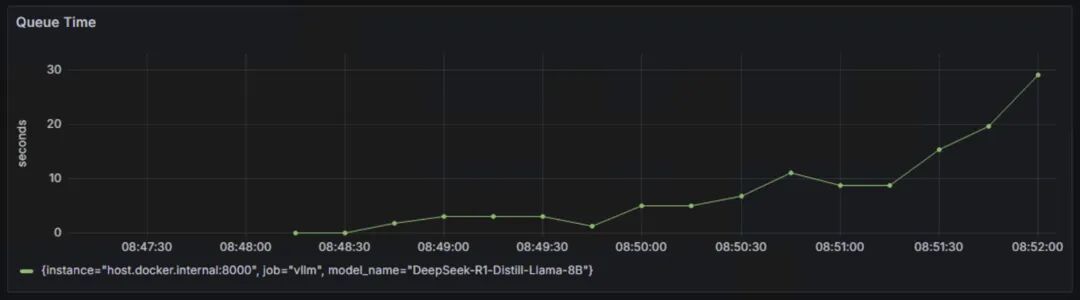
Scheduler State:Num waiting持续上升,从0增加到600左右,表示系统积压了大量的等待处理请求,处理能力已经到到瓶颈,当前配置的计算资源已经无法满足请求处理需求。
Queue Time:队列等待时间从接近0秒快速上升到接近30秒,曲线呈现持续上升的趋势,这说明在队列中的等待时间越来越长,系统处理能力不足导致请求堆积。
3
延迟指标
TTFT:首token延迟。
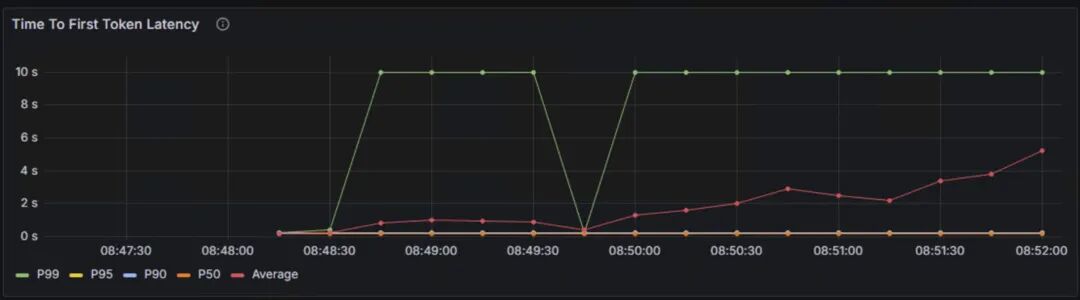
P99延迟约10秒,P50延迟为5秒,平均延迟呈上升趋势,从0.5秒上升到5秒,说明随着时间的推移,系统负载可能在增加。
TPOT:每个输出token的延迟。
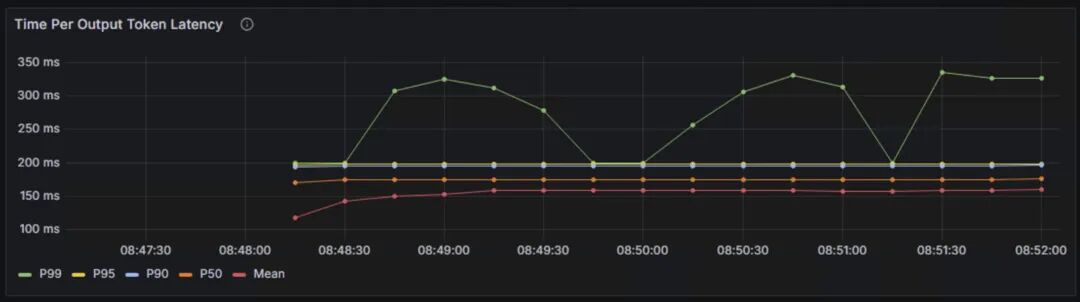
P99延迟为300ms-350ms,P50和平均延迟稳定在150ms-200ms之间,说明整体token输出的速度比较稳定。
TPOT是主要影响客户感受的指标,普通人的一般阅读速度在200~300词每分钟,一般100ms以内可以保证流畅的用户体验,400ms以内可以保持用户注意力。
4
整体延迟
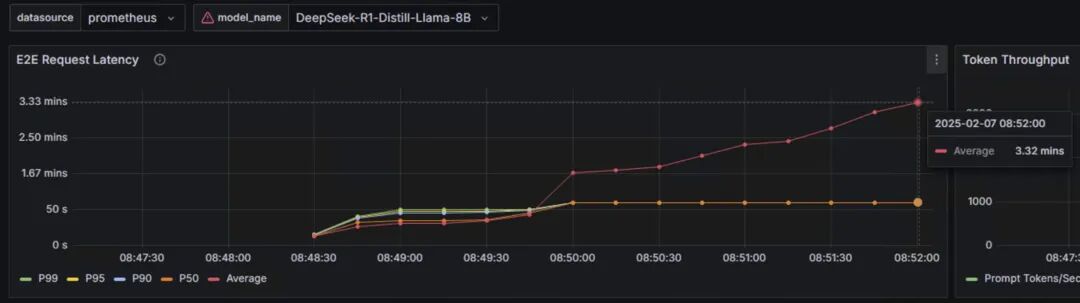
端到端的请求延迟从10秒左右逐渐上升到3分钟,平均延迟也呈上升趋势,表明系统存在性能瓶颈。
从这三个性能指标来看:
P50延迟延迟相对稳定,说明大部分请求响应正常,每个输出token的延迟稳定,保证了生成的连续性。
首token延迟偏高,特别是P99延迟,端到端延迟持续增长。
token间延迟高于理想值。
5
吞吐量指标
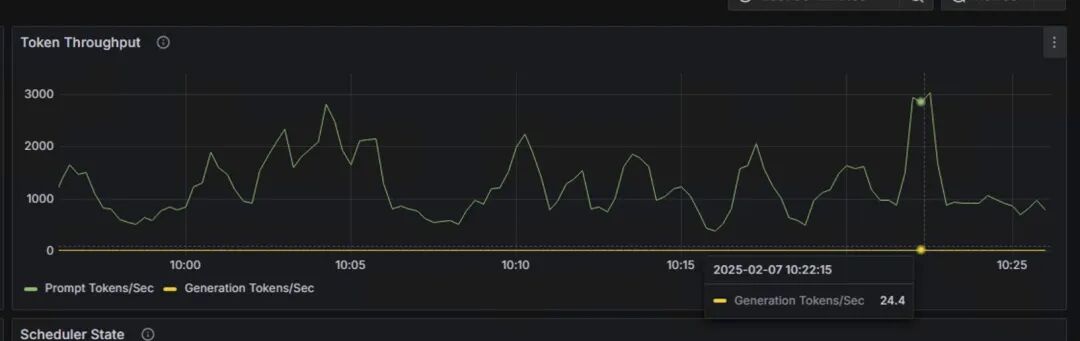
每秒产生的token数:图上检查点为24.4 token/s。
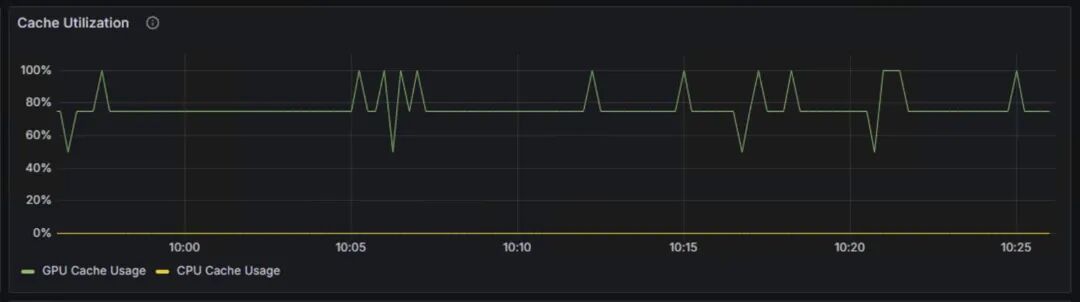
Cache Utilization:展示了GPU Cache Usage和CPU Cache Usage,分别代表GPU显存中KV缓存的使用率,和CPU内存中KV缓存的使用率。当GPU显存接近饱和时,会将部分请求换出到CPU内存中。CPU-GPU的数据传输会带来额外开销,影响推理性能。
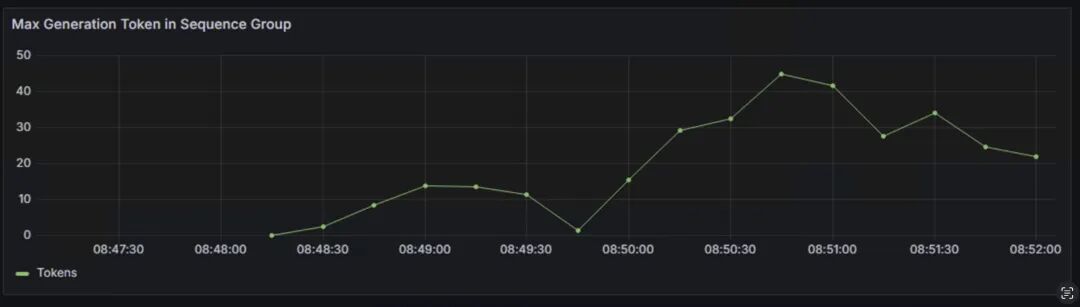
Max Generation Token in Sequence Group:表示每个序列组中生成的最大token数量,反映了模型生成文本长度的动态变化。生成token的数量会影响推理延迟、GPU内存使用和系统整体的吞吐量。
该参数受到max_tokens、min_tokens和stop_token_ids、ignore_eos和bad_words等影响,详情可参阅下方链接。
https://docs.vllm.ai/en/latest/api/inference_params.html
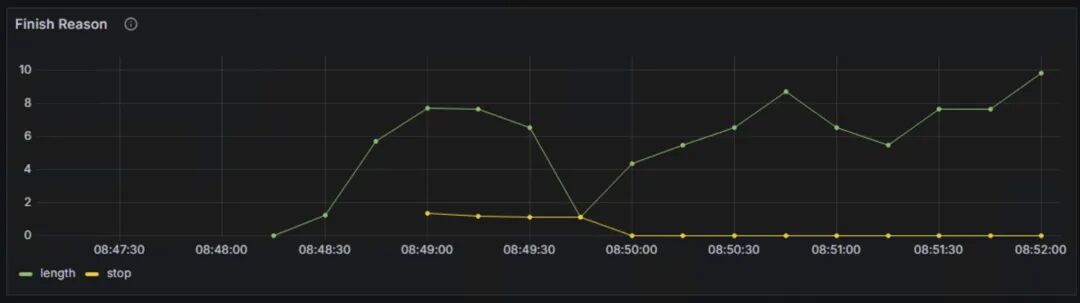
Finish Reasons:反映了生成过程结束的原因,主要包含由长度限制结束和由停止条件结束。长度限制包含达到max_token设定的最大生成长度,和达到模型的最大上下文长度限制。停止条件结束包含遇到停止字符串,遇到指定的停止token id和模型的结束符号(EOS token)。
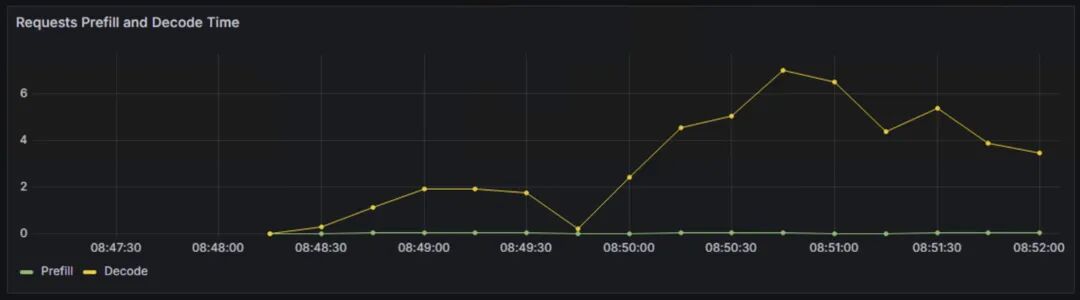
Requests Prefill和Decode Time:分别表示处理输入prompt阶段的时间和生成新token的时间。prefill影响首token延迟,Decode影响token间延迟。
总结
本文介绍了如何使用Prometheus和Grafana,监控基于vLLM部署的DeepSeek蒸馏后的llama模型性能,讨论了关注模型性能指标的重要性和关键指标。
同时,文章详细说明了Prometheus和Grafana的配置方法,并对Dashboard中的核心性能指标进行了深入分析。
通过这些指标的综合分析,可以有效评估模型部署的性能表现,及时发现系统瓶颈,优化资源配置,在保证用户体验的同时,有效控制成本。

参考链接
使用亚马逊云科技自研芯片Inferentia2
部署DeepSeek R1 Distillation模型(一):
https://aws.amazon.com/cn/blogs/china/deploying-the-deepseek-r1-distillation-model-using-amazon-inferentia2/
使用亚马逊云科技自研芯片Inferentia2
部署DeepSeek R1 Distillation模型(二):
https://aws.amazon.com/cn/blogs/china/deploying-the-deepseek-r1-distillation-model-using-amazon-inferentia2-part-two/
Amazon Neuron引入对Trainium2和NxD Inference的支持:
https://aws.amazon.com/cn/about-aws/whats-new/2024/12/aws-neuron-trainium2-nxd-inference/
vLLM User Guide for NxD Inference:
https://awsdocs-neuron.readthedocs-hosted.com/en/latest/libraries/nxd-inference/developer_guides/vllm-user-guide.html
NxD Inference:
https://awsdocs-neuron.readthedocs-hosted.com/en/latest/libraries/nxd-inference/nxdi-overview.html#nxdi-overview
Deploying DeepSeek model on Amazon inferentia with vLLM:
https://community.aws/content/2sKnCT05v1WiD0Dw8QB5wfAf1Cm/deploying-deepseek-llama-model-on-amazon-ec2-inferentia-instance
LLM推理优化:
https://github.com/ninehills/llm-inference-benchmark/blob/main/LLM%E6%8E%A8%E7%90%86%E4%BC%98%E5%8C%96.md
vllm examples for prometheus&grafana:
https://docs.vllm.ai/en/latest/getting_started/examples/prometheus_grafana.html
Deploy large language models on Amazon Inferentia2 using large model inference containers:
https://aws.amazon.com/cn/blogs/machine-learning/deploy-large-language-models-on-aws-inferentia2-using-large-model-inference-containers/
本篇作者

冯源
亚马逊云科技解决方案架构师。工作涉及企业混合云环境运维管理、运营管理、混合云平台和云服务解决方案。有十余年企业基础设施咨询及实施、项目管理和交付以及混合云平台研发管理经验。2022年加入亚马逊云科技,关注Greenfield客户使用亚马逊云科技的场景,曾负责广告、零售、餐饮,制造和教育等客户。

何培培
亚马逊云科技解决方案架构师,负责基于亚马逊云科技的云计算方案架构咨询和设计。
我们正处在Agentic AI爆发前夜。企业要从"成本优化"转向"创新驱动",通过完善的数据战略和AI云服务,把握全球化机遇。亚马逊将投入1000亿美元在AI算力、云基础设施等领域,通过领先的技术实力和帮助“中国企业出海“和”服务中国客户创新“的丰富经验,助力企业在AI时代突破。


 被折叠的 条评论
为什么被折叠?
被折叠的 条评论
为什么被折叠?
 到【灌水乐园】发言


