


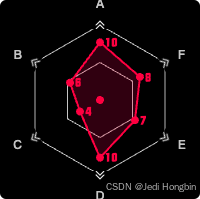
如图 六个角都有自定义图表
默认没找到配置项
使用graphic自己绘制实现
绘制六个矩形 和背景相同颜色来实现遮挡 再在上main根据角度绘制图片
<!DOCTYPE html>
<html>
    <head>
        <meta charset="UTF-8" />
        <title>Radar with Rotated Squares and Images</title>
        <script src="https://cdn.jsdelivr.net/npm/echarts@5.6/dist/echarts.min.js"></script>
        <style>
            #main {
                width: 200px;
                height: 200px;
            }
        </style>
        <style>
            /* 在 CSS 文件中定义自定义字体 */
            @font-face {
                font-family: "MyCustomFont"; /* 自定义字体名称 */
                src: url("public/只含数字.ttf");
                font-weight: normal;
                font-style: normal;
            }
        </style>
    </head>
    <body>
        <div id="main"></div>

        <script>
            const chartDom = document.getElementById("main");
            const myChart = echarts.init(chartDom);

            console.dir(chartDom)

            const radius = 75;
            const centerX = 100;
            const centerY = 100;
            const squareSize = 16;

            const imageUrl = "/public/arrow.png"; // 替换成你自己的 16x16 图片链接

            // 计算六个顶点位置和角度
            const graphics = [];
            for (let i = 0; i < 6; i++) {
                const angle = (Math.PI / 3) * i - Math.PI / 2;
                const x = centerX + radius * Math.cos(angle);
                const y = centerY + radius * Math.sin(angle);

                // 外层旋转方块
                graphics.push({
                    type: "group",
                    position: [x, y],
                    rotation: (Math.PI / -3) * i,
                    children: [
                        {
                            type: "rect",
                            shape: {
                                x: -squareSize / 2,
                                // 窄一些 放置和label重合
                                y: -squareSize / 2 / 2,
                                width: squareSize,
                                height: squareSize / 2,
                            },
                            style: {
                                // 和背景重色 以达到透明间隙
                                // 或者 用图片背景 重色
                                fill: "#000",
                            },
                            // 用z来覆盖下层
                            z: 2,
                        },
                        {
                            type: "image",
                            style: {
                                image: imageUrl,
                                x: -squareSize / 2,
                                y: -squareSize / 2,
                                width: squareSize,
                                height: squareSize,
                            },
                            z: 2,
                        },
                    ],
                });
            }

            const option = {
                backgroundColor: "#000",
                radar: {
                    center: ["50%", "50%"],
                    radius: radius,
                    indicator: [
                        // 高度大一些 放置数字和边角重合
                        { name: "A", max: 10 + 3 },
                        { name: "B", max: 10 + 3 },
                        { name: "C", max: 10 + 3 },
                        { name: "D", max: 10 + 3 },
                        { name: "E", max: 10 + 3 },
                        { name: "F", max: 10 + 3 },
                    ],
                    shape: "polygon",
                    splitNumber: 2,
                    axisName: {
                        color: "#ccc",
                        fontWeight: "bold",
                    },
                    splitLine: {
                        lineStyle: {
                            color: "#ccc",
                            width: 1,
                        },
                    },
                    splitArea: {
                        show: false,
                    },
                    axisLine: {
                        show: false,
                    },
                },
                series: [
                    {
                        type: "radar",
                        data: [
                            {
                                value: [10, 6, 4, 10, 7, 8],
                                areaStyle: {
                                    color: "rgba(255, 0, 64, 0.3)",
                                },
                                lineStyle: {
                                    color: "#f04",
                                },
                                itemStyle: {
                                    color: "#f04",
                                },
                                label: {
                                    show: true,
                                    color: "#f04",
                                    fontSize: 12,
                                    // 尽量减少文字和镂空部分重叠
                                    position: "right",
                                    distance: 1,
                                    fontFamily: "MyCustomFont",
                                    formatter: function (params) {
                                        return params.value;
                                    },
                                    z: 3,
                                },
                            },
                        ],
                        z: 1,
                    },
                ],
                graphic: [
                    {
                        type: "circle",
                        left: "center",
                        top: "center",
                        shape: {
                            r: 4,
                        },
                        style: {
                            fill: "#f04",
                        },
                    },
                    ...graphics,
                ],
            };

            myChart.setOption(option);
        </script>
    </body>
</html>


 8199
8199

 被折叠的 条评论
为什么被折叠?
被折叠的 条评论
为什么被折叠?
 到【灌水乐园】发言


