<div id="pie-chart" style="width: 400px; height: 200px"></div>
<script>
export default{
data(){
return {}
},
mounted(){
this.init()
},
methods:{
init(){
const pieChart = this.$echarts.init(document.getElementById('pie-chart'), null, { renderer: 'svg' })
let option = {
tooltip: {
trigger: 'item',
pading: [12, 16],
borderColor: '#fff',
textStyle: {
color: '#333',
fontSize: 12
}
},
legend: {
orient: "vertical",
align: 'left',
bottom: '0',
left: 'right',
icon: 'circle',
itemWidth: 9,
textStyle: {
color: '#8C8C8C',
fontSize: 12
}
},
series: [
{
type: 'pie',
radius: ['40%', '70%'],
avoidLabelOverlap: false,
label: {
show: true,
formatter: '{d} %',
fontSize: 12,
color: '#666',
},
labelLine: {
show: true,
length2:5
},
itemStyle:{
normal:{
borderWidth:1,
borderColor:'#fff'
}
},
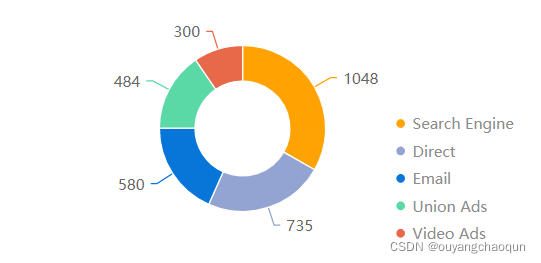
color: ['#FFA202', '#93A3D2', '#0776D8','#5AD8A6','#E8684A'],
data: [
{ value: 1048, name: 'Search Engine' },
{ value: 735, name: 'Direct' },
{ value: 580, name: 'Email' },
{ value: 484, name: 'Union Ads' },
{ value: 300, name: 'Video Ads' }
]
}
]
}
pieChart.clear();
setTimeout(() => {pieChart.setOption(option)}, 100)}
}
}
</script>


 本文介绍了如何使用ECharts库在JavaScript中创建动态的饼状图,展示了数据配置和初始化过程,适合前端开发者学习数据可视化实践。


 570
570

 被折叠的 条评论
为什么被折叠?
被折叠的 条评论
为什么被折叠?
 到【灌水乐园】发言


